PROTECTED SOURCE SCRIPT
Head & Shoulders Pattern (Zeiierman)
█ Overview
The Head & Shoulders Pattern (Zeiierman) is an advanced pattern recognition tool that automatically detects and visualizes one of the most powerful reversal patterns in technical analysis — the classic Head & Shoulders and Inverse Head & Shoulders formations.
This indicator brings structure clarity directly onto the price chart, allowing traders to instantly spot potential major reversal zones without manually drawing or searching for patterns.
It doesn't just draw lines — it intelligently scans price action for symmetry, pivot behavior, and neckline structures — then projects realistic price targets based on the pattern's height.

█ How It Works
The indicator combines multiple technical detection layers into a clean visual model:
█ How to Use
⚪ Reversal Trading
Look for Head & Shoulders at the top of an uptrend

Look for Inverse Head & Shoulders at the bottom of a downtrend

█ Common Real-World Stop Loss Strategies with Head & Shoulders Patterns
Not all Head & Shoulders patterns are created equal — and neither are the stop loss strategies used to trade them.
Depending on your trading style, risk tolerance, and market context — here are the 3 most common ways traders manage stop placement when trading Head & Shoulders (H&S) or Inverse Head & Shoulders (iH&S) patterns:
⚪ Conservative Stop Placement
Maximum Safety — Minimum Chance of Being Stopped Prematurely
Stop Placement:
⚪ Aggressive Stop Placement
Tighter Risk — Faster Invalidations
Stop Placement:

⚪ Neckline Reclaim Invalidation
Dynamic & Price-Action Based Exit
Stop Placement:

█ Why It's Useful
This is not a basic pattern drawing tool — it's a complete detection system built for traders who want to:
█ Settings
Pivot Detection
Visualization
Target Projection
-----------------
Disclaimer
The content provided in my scripts, indicators, ideas, algorithms, and systems is for educational and informational purposes only. It does not constitute financial advice, investment recommendations, or a solicitation to buy or sell any financial instruments. I will not accept liability for any loss or damage, including without limitation any loss of profit, which may arise directly or indirectly from the use of or reliance on such information.
All investments involve risk, and the past performance of a security, industry, sector, market, financial product, trading strategy, backtest, or individual's trading does not guarantee future results or returns. Investors are fully responsible for any investment decisions they make. Such decisions should be based solely on an evaluation of their financial circumstances, investment objectives, risk tolerance, and liquidity needs.
The Head & Shoulders Pattern (Zeiierman) is an advanced pattern recognition tool that automatically detects and visualizes one of the most powerful reversal patterns in technical analysis — the classic Head & Shoulders and Inverse Head & Shoulders formations.
This indicator brings structure clarity directly onto the price chart, allowing traders to instantly spot potential major reversal zones without manually drawing or searching for patterns.
It doesn't just draw lines — it intelligently scans price action for symmetry, pivot behavior, and neckline structures — then projects realistic price targets based on the pattern's height.
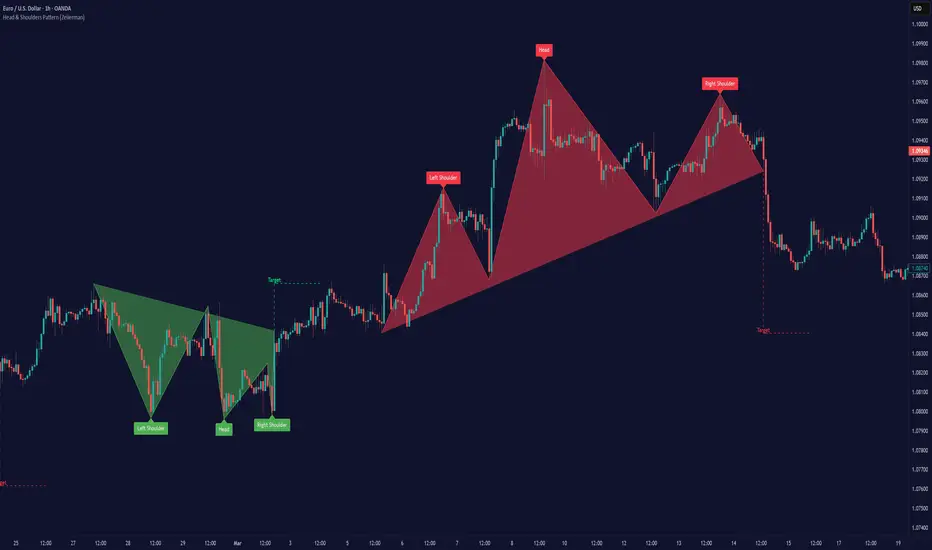
⚪ In simple terms:
▸ Standard Head & Shoulders → Bearish Reversal Pattern
▸ Inverse Head & Shoulders → Bullish Reversal Pattern
▸ Target Projection → Estimated Move from Neckline Break
▸ Labels → Clear annotation of Left Shoulder, Head, and Right Shoulder
█ How It Works
The indicator combines multiple technical detection layers into a clean visual model:
⚪ Dynamic Pivot Engine
Automatically detects pivot highs and lows based on user-defined Period.
- Longer Period = Broader, higher-confidence patterns
- Shorter Period = Smaller, more frequent patterns
⚪ Pattern Detection Logic
Scans pivot structures in real-time to identify valid:
- Bearish Head & Shoulders (H&S)
- Bullish Inverse Head & Shoulders (iH&S)
Conditions include:
▸ Symmetry validation
▸ Head above (or below) Shoulders
▸ Neckline structure
▸ Minimum price conditions met
█ How to Use
⚪ Reversal Trading
Look for Head & Shoulders at the top of an uptrend
Look for Inverse Head & Shoulders at the bottom of a downtrend
⚪ What makes our tool truly unique is that it goes beyond the traditional textbook definition.
Our custom Head & Shoulders algorithm is built with flexibility and adaptability in mind. It dynamically responds to real-time price action, allowing it to detect valid patterns not only at major trend reversals — but also within trending environments.
That means you can spot Head & Shoulders formations at:
- Consolidation zones
- Trend continuation areas
- Corrective phases within established trends
It doesn’t have to be the absolute top or bottom of a move — and that’s the real power of this tool. It adapts. It evolves. It finds structure where most indicators stay blind.
█ Common Real-World Stop Loss Strategies with Head & Shoulders Patterns
Not all Head & Shoulders patterns are created equal — and neither are the stop loss strategies used to trade them.
Depending on your trading style, risk tolerance, and market context — here are the 3 most common ways traders manage stop placement when trading Head & Shoulders (H&S) or Inverse Head & Shoulders (iH&S) patterns:
⚪ Conservative Stop Placement
Maximum Safety — Minimum Chance of Being Stopped Prematurely
Stop Placement:
- Above the Head (Bearish H&S)
- Below the Head (Bullish iH&S)
- Pros: Safest approach. Provides maximum protection against false breakouts and noise.
- Cons: Often results in very large stop losses, especially on bigger patterns or higher timeframes. Risk-to-Reward (RR) can be poor unless the target is far.
⚪ Aggressive Stop Placement
Tighter Risk — Faster Invalidations
Stop Placement:
- Above the Right Shoulder (Bearish H&S)
- Below the Right Shoulder (Bullish iH&S)
- Pros: Smaller stop losses. Improved RR. Ideal for traders who want tighter control over risk.
- Cons: Higher chance of getting stopped on retests or minor volatility around the neckline zone.
⚪ Neckline Reclaim Invalidation
Dynamic & Price-Action Based Exit
Stop Placement:
- Exit the trade if price closes back above (bearish) or below (bullish) the neckline after breaking it.
- Pros: Dynamic approach based on market behavior rather than static levels. Allows more flexibility.
- Cons: Requires active trade management. Not suitable for fully automated or set-and-forget trading styles.
█ Why It's Useful
This is not a basic pattern drawing tool — it's a complete detection system built for traders who want to:
- Automatically detect powerful reversal patterns
- Avoid the subjectivity of manually drawing H&S structures
- Trade with clear target projections
- Identify high-probability reversal zones
- Visually map structure shifts in real-time
█ Settings
Pivot Detection
- Period → Number of bars used to scan for pivots (Higher = Bigger patterns)
- Enable Bullish Head & Shoulders
- Enable Bearish Head & Shoulders
Visualization
- Customize Colors (Lines, Fills, Labels)
- Enable/Disable Labels
- Pattern Style: Closed / Open
- Custom Label Colors
Target Projection
- Enable/Disable Target Projection
- Customize Target Colors
-----------------
Disclaimer
The content provided in my scripts, indicators, ideas, algorithms, and systems is for educational and informational purposes only. It does not constitute financial advice, investment recommendations, or a solicitation to buy or sell any financial instruments. I will not accept liability for any loss or damage, including without limitation any loss of profit, which may arise directly or indirectly from the use of or reliance on such information.
All investments involve risk, and the past performance of a security, industry, sector, market, financial product, trading strategy, backtest, or individual's trading does not guarantee future results or returns. Investors are fully responsible for any investment decisions they make. Such decisions should be based solely on an evaluation of their financial circumstances, investment objectives, risk tolerance, and liquidity needs.
Protected script
This script is published as closed-source. However, you can use it freely and without any limitations – learn more here.
Access my indicators at: zeiierman.com/
Join Our Free Discord: discord.gg/zeiiermantrading
Join Our Free Discord: discord.gg/zeiiermantrading
Disclaimer
The information and publications are not meant to be, and do not constitute, financial, investment, trading, or other types of advice or recommendations supplied or endorsed by TradingView. Read more in the Terms of Use.