PROTECTED SOURCE SCRIPT
Outcome Reach - Days / Weeks Separator - 2nd
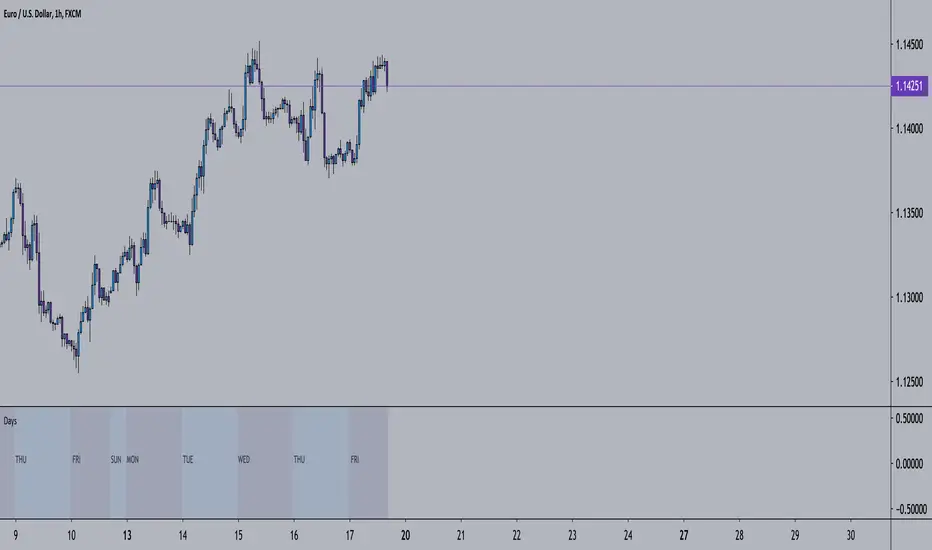
With the first Outcome Reach indicator, this will help you see price action divided by days (black lines) and weeks (yellow lines). This is the second indictor out of a set of 3.
Do note this will not work as well on higher timeframes.
Do note this will not work as well on higher timeframes.
Disclaimer
The information and publications are not meant to be, and do not constitute, financial, investment, trading, or other types of advice or recommendations supplied or endorsed by TradingView. Read more in the Terms of Use.