PROTECTED SOURCE SCRIPT
Elliot

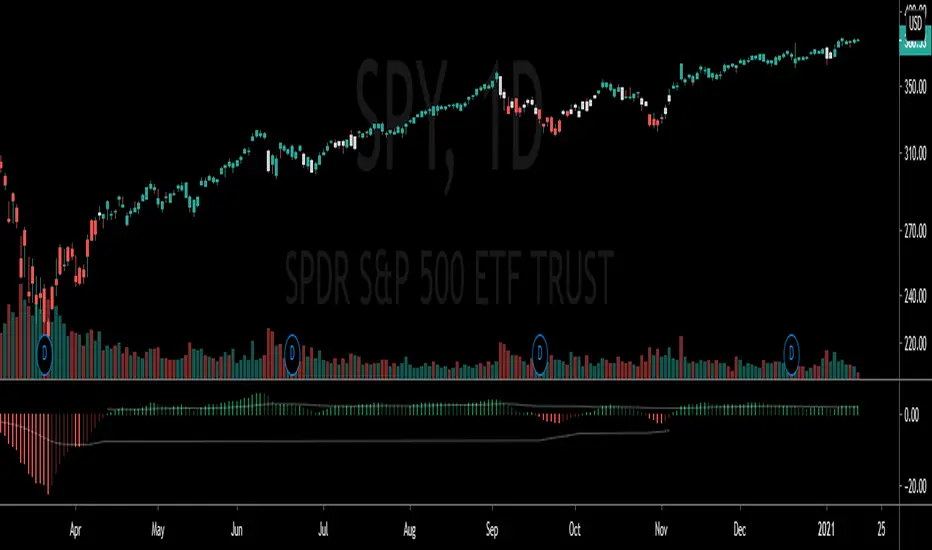
Elliott Wave Oscilator, indicating possible waves 3, 4 and 5
Waves3: Indicated in RED Line(Upwards) and Green Line(Downwards)
- Detects wave greater than SMA
Waves4: Maximum height indicated in yellow Line
- Detects when wave greater than SMA (Wave 3 or 5) approaches wave 4 regression point
Waves5: Indicated in White Line
- Detects divergence in oscilator and price, meaning end of trend
////Working on Elliott wave projections with PRICE
Appreciate any suggestions, collaboration, comments or ideas.
Disclaimer
The information and publications are not meant to be, and do not constitute, financial, investment, trading, or other types of advice or recommendations supplied or endorsed by TradingView. Read more in the Terms of Use.