OPEN-SOURCE SCRIPT
Stochastic Ribbon
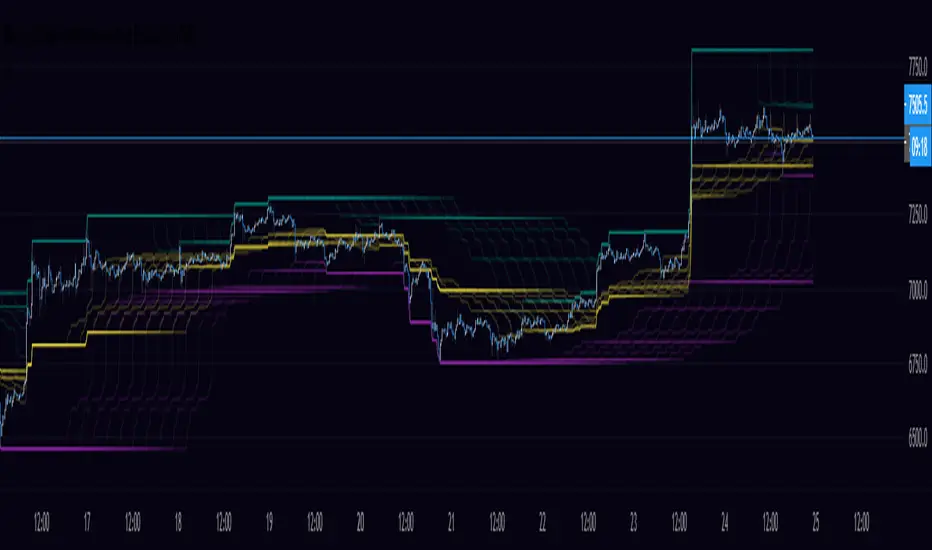
A series of highs and lows of different lengths to create a ribbon-like indicator to emulate the stochastic oscillator's top (100), middle (50) and bottom (0). Traders can determine the strength of the support and resistance by the number of converging lines, choose price points and visualise momentum waves.
Inputs:
Theme: multiple colours/themes (theme 2)
Length: high/low length (14)
Start: plot number to start ribbon on (1)
PlotNumber: number of plots to show; maximum 10 per top, middle, bottom (10)
Example:
Length: 14
Start: 5
PlotNumber: 10
Inputs:
Theme: multiple colours/themes (theme 2)
Length: high/low length (14)
Start: plot number to start ribbon on (1)
PlotNumber: number of plots to show; maximum 10 per top, middle, bottom (10)
Example:
Length: 14
Start: 5
PlotNumber: 10
Open-source script
In true TradingView spirit, the author of this script has published it open-source, so traders can understand and verify it. Cheers to the author! You may use it for free, but reuse of this code in publication is governed by House rules. You can favorite it to use it on a chart.
Disclaimer
The information and publications are not meant to be, and do not constitute, financial, investment, trading, or other types of advice or recommendations supplied or endorsed by TradingView. Read more in the Terms of Use.