OPEN-SOURCE SCRIPT
MZ SRSI Strategy V1.0
Strategy Introduction
Default Settings
Suggestions for Usage
Mostly winning trades have no prominent drawdown so losing trades can be abolished with Stoploss. Would soon add Stoploss, MTF and Takeprofit options in next version. Also if you want an alerts version of it then just comment below and would publish it later. I’ve found this strategy useful on 1D and 4h timeframes with described default settings.
- This strategy starts from selection of 1st Moving Average from one of following:
SMA
EMA
DEMA
TEMA
LRC
WMA
MF
VAMA
TMA
HMA
JMA
Kijun v2
EDSMA
McGinley - Then it calculates the RSI of selected 1st Moving Average
- In the end it calculates Moving Average of previously calculated RSI and for this purpose 2nd Moving Average is also selected from above list.
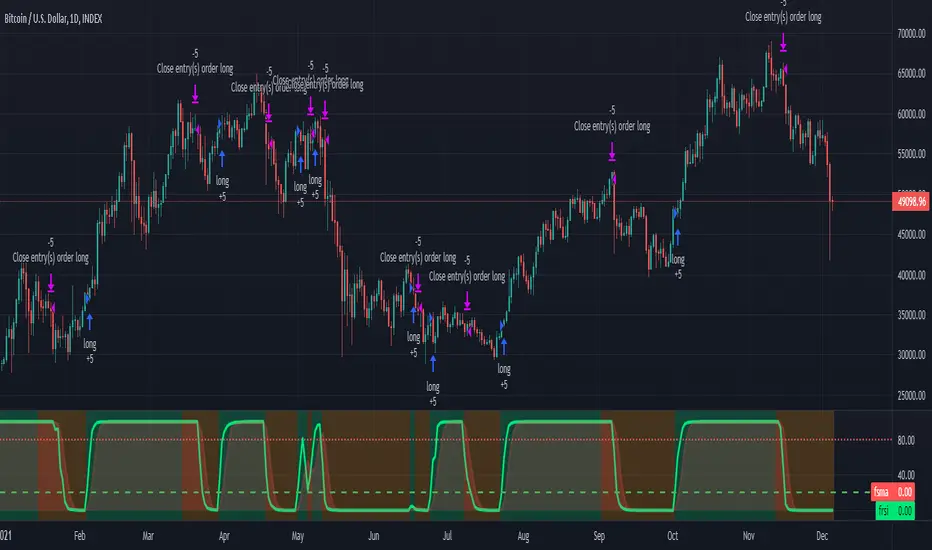
- Cross of RSI and its Moving Average generates Strategy Alerts
- Only long trades are enabled currently
Default Settings
- I've set the default selection to the perfect options for 1D and 4h timeframes. You can modify both MAs selection and their length according to your selected timeframe.
- Following default settings are used:
- Heiken Ashi Candles are selected by default as source
- 1st Moving Average selection is set to LRC (Linear Regression Curve)
- Length of 1st Moving Average is set to 50
- RSI length is set to 2 because it is supposed to be fast
- 2nd Moving Average of RSI is set to TMA (Triangular Moving Average)
- Length of 1st Moving Average is set to 5
- Start date is set to 2011
- Backtesting can also be done selecting %age of equity
- Heiken Ashi Candles are selected by default as source
Suggestions for Usage
Mostly winning trades have no prominent drawdown so losing trades can be abolished with Stoploss. Would soon add Stoploss, MTF and Takeprofit options in next version. Also if you want an alerts version of it then just comment below and would publish it later. I’ve found this strategy useful on 1D and 4h timeframes with described default settings.
Open-source script
In true TradingView spirit, the author of this script has published it open-source, so traders can understand and verify it. Cheers to the author! You may use it for free, but reuse of this code in publication is governed by House rules. You can favorite it to use it on a chart.
Disclaimer
The information and publications are not meant to be, and do not constitute, financial, investment, trading, or other types of advice or recommendations supplied or endorsed by TradingView. Read more in the Terms of Use.