OPEN-SOURCE SCRIPT
Resistance/Support Indicator - Fontiramisu
Updated

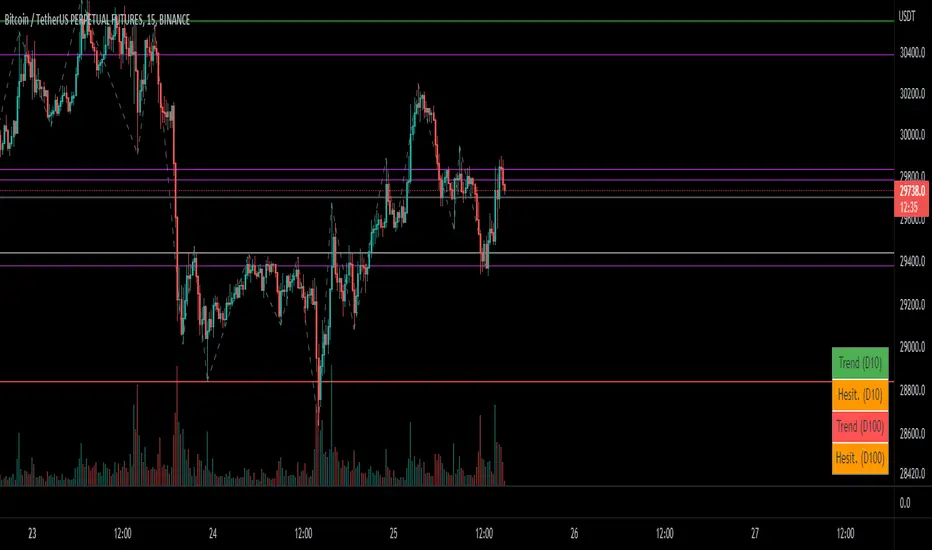
Indicator showing resistances and support, based on pivots location
When a new pivot location is near from a resistance/support the latter gains weight.
You can modify multiple parameters :
Pivots are calculated with deviation parameter to validate with more precision.
Fontilab Library is used to code this indicator.
When a new pivot location is near from a resistance/support the latter gains weight.
You can modify multiple parameters :
- Nb Max res/sup : Define the number max res/sup to keep in our res/sup history array. The greater it is the older bar index will be taken.
- Nb show res/sup : Define the number of res/sup to be drawn.
- Min weight shown : Define min res/sup weight to be shown. Weight is used to measure strengh of res/sup.
- % range stack : Define price percentage change required to stack a pivot into an existing res/sup. Default is 0.015 = 1.5%.
Pivots are calculated with deviation parameter to validate with more precision.
Fontilab Library is used to code this indicator.
Release Notes
- Added table display functionality: you can now see the weight of your top res/sup in the bottom right corner.
- The calculation has changed a little to avoid multiple res/sup at the same price.
- Default parameters changed to be more relevant but you are encouraged to find the most effective combo.
- Bug fix.
Release Notes
Bug FixRelease Notes
- Bug Fix
- Change line style
Open-source script
In true TradingView spirit, the author of this script has published it open-source, so traders can understand and verify it. Cheers to the author! You may use it for free, but reuse of this code in publication is governed by House rules. You can favorite it to use it on a chart.
Disclaimer
The information and publications are not meant to be, and do not constitute, financial, investment, trading, or other types of advice or recommendations supplied or endorsed by TradingView. Read more in the Terms of Use.