INVITE-ONLY SCRIPT
EOD re-entries
Updated

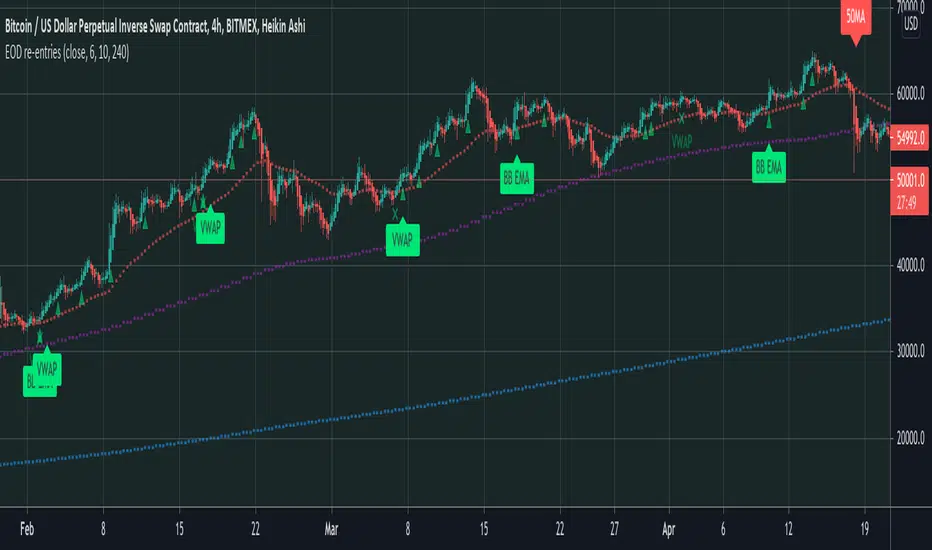
This indicator is designed to compliment another of my trading scripts which gives signals for long-term trends on the daily chart. Here, I'm using the same daily 50 and 200MAs, but projecting them on the 4 hour chart to potentially catch faster trade re-entry points.
There are built in alerts for the following:
- Long: The price closed above the daily 50 MA while the 4 hour VWAP is above the MVWAP
- Long: The price closed above the daily 200 MA while the 4 hour VWAP is above the MVWAP
- Short: The price closed below the daily 50 MA while the 4 hour VWAP is below the MVWAP
- Short: The price closed below the daily 200 MA while the 4 hour VWAP is below the MVWAP
- VWAP long re-entry (large green triangle): The price closes above the VWAP and both the 50 & 200 MAs
- VWAP short re-entry (large red triangle): The price closes below the VWAP and both the 50 & 200 MAs
- EMA long re-entry (small green triangle): 4 EMAs of your choosing are fanning out above the 50 & 200 MAs when the price is above VWAP
- EMA short re-entry (small red triangle): 4 EMAs of your choosing are fanning out below the 50 & 200 MAs when the price is below VWAP
All of the above are filtered against stochastic RSI and numerous other oscillators to reinforce the signals.
This is a private script. Please DM me for access.
Release Notes
Added text to VWAP labels to distinguish between those and EMA entries.Release Notes
I've improved the existing EMA alerts by validating them against my Balance Builder system. Should the EMAs fan out within 6 candles of a Balance Builder (BB) alert, 'BBEMA' is triggered, signalling that the trade should be taken.Release Notes
Added an additional alert for filtered VWAP crosses that are confirmed after 3 bars.Invite-only script
Access to this script is restricted to users authorized by the author and usually requires payment. You can add it to your favorites, but you will only be able to use it after requesting permission and obtaining it from its author. Contact colinmck for more information, or follow the author's instructions below.
TradingView does not suggest paying for a script and using it unless you 100% trust its author and understand how the script works. In many cases, you can find a good open-source alternative for free in our Community Scripts.
Want to use this script on a chart?
Warning: please read before requesting access.
Disclaimer
The information and publications are not meant to be, and do not constitute, financial, investment, trading, or other types of advice or recommendations supplied or endorsed by TradingView. Read more in the Terms of Use.