OPEN-SOURCE SCRIPT
Support/Resistant Zone (Simple)
The concepts of trading level support and resistance are undoubtedly two of the most highly discussed attributes of technical analysis.
Support is a price level where a downtrend can be expected to pause due to a concentration of demand or buying interest. As the price of assets or securities drops, demand for the shares increases, thus forming the support line. Meanwhile, resistance zones arise due to selling interest when prices have increased.

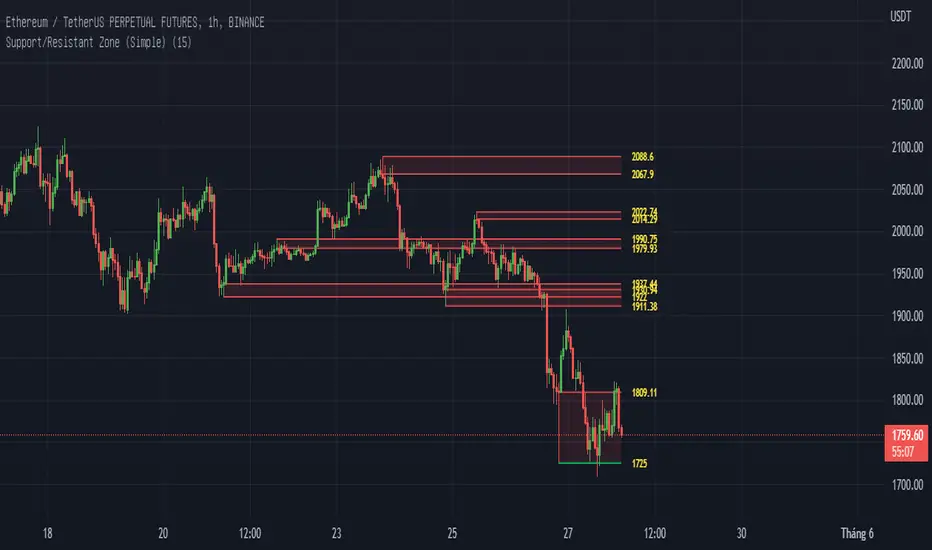
There are many ways to identify support and resistance zones. This indicator is a simple method to identify them. Support/Resistant zones will draw basing on the size of the wick for candles, which are Pivots High/Low before.
Support is a price level where a downtrend can be expected to pause due to a concentration of demand or buying interest. As the price of assets or securities drops, demand for the shares increases, thus forming the support line. Meanwhile, resistance zones arise due to selling interest when prices have increased.
There are many ways to identify support and resistance zones. This indicator is a simple method to identify them. Support/Resistant zones will draw basing on the size of the wick for candles, which are Pivots High/Low before.
Open-source script
In true TradingView spirit, the author of this script has published it open-source, so traders can understand and verify it. Cheers to the author! You may use it for free, but reuse of this code in publication is governed by House rules. You can favorite it to use it on a chart.
Disclaimer
The information and publications are not meant to be, and do not constitute, financial, investment, trading, or other types of advice or recommendations supplied or endorsed by TradingView. Read more in the Terms of Use.