OPEN-SOURCE SCRIPT
BitCoin RSI Trend
Updated
What is it?
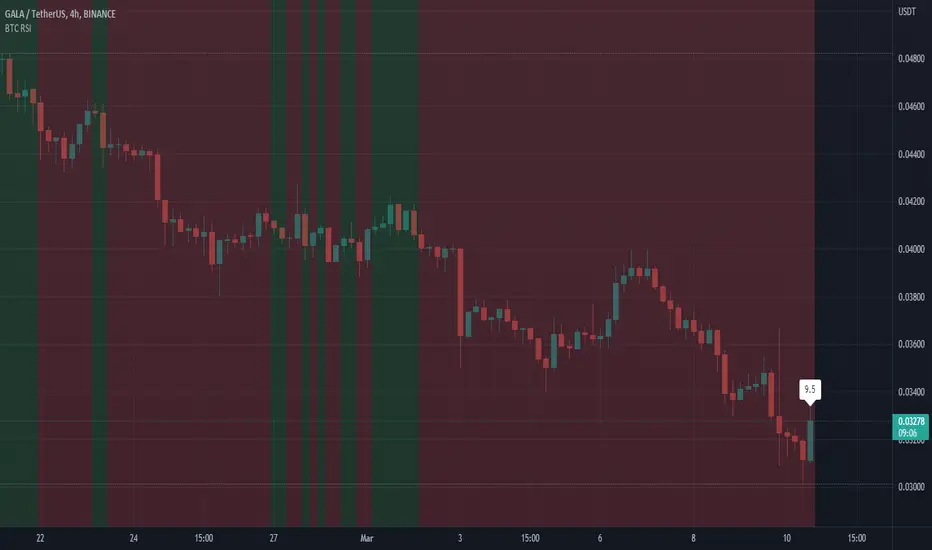
This indicator will plot the RSI of BTC with a red or green background based on the top and bottom values which you can set.
How to use it?
For example, you want to trade only if the RSI of BTC is between 50 and 70, so the top value is 70 and bottom is 50. If the RSI value between those values the background will be green, else it will be red.
Why to use it?
The buy and sell strength of the BTC controls the other coins, and it is noticeable when the BTC is over sold and the RSI exceeding the 70, the price will reverse its movement to down, thus it is advisable to not open long position if the RSI of BTC is above the 70-75. Also, if the RSI is under 50 there is a big possibility to move down further to the over bought areas. The best is to buy a altcoins when the BTC RSI is between 50 and 70.
For example, I could avoid a bad long trade on MATICUSDT when the RSI of BTC is going under 50

Or, get a good long trade on MATICUSDT when the RSI of BTC is between 50 and 70

This indicator will plot the RSI of BTC with a red or green background based on the top and bottom values which you can set.
How to use it?
For example, you want to trade only if the RSI of BTC is between 50 and 70, so the top value is 70 and bottom is 50. If the RSI value between those values the background will be green, else it will be red.
Why to use it?
The buy and sell strength of the BTC controls the other coins, and it is noticeable when the BTC is over sold and the RSI exceeding the 70, the price will reverse its movement to down, thus it is advisable to not open long position if the RSI of BTC is above the 70-75. Also, if the RSI is under 50 there is a big possibility to move down further to the over bought areas. The best is to buy a altcoins when the BTC RSI is between 50 and 70.
For example, I could avoid a bad long trade on MATICUSDT when the RSI of BTC is going under 50
Or, get a good long trade on MATICUSDT when the RSI of BTC is between 50 and 70
Release Notes
Changing the RSI calculation with security function.Release Notes
Making the code shorter.Release Notes
Added BTC RSI value labelOpen-source script
In true TradingView spirit, the author of this script has published it open-source, so traders can understand and verify it. Cheers to the author! You may use it for free, but reuse of this code in publication is governed by House rules. You can favorite it to use it on a chart.
Disclaimer
The information and publications are not meant to be, and do not constitute, financial, investment, trading, or other types of advice or recommendations supplied or endorsed by TradingView. Read more in the Terms of Use.