PROTECTED SOURCE SCRIPT
Custom Timeframe Indicators(MA,EMA,BB) [CryptoProSignal]
Updated
This is a combination of 3 types of indicators :
1) Simple Moving Average
2) Exponential Moving Average
3) Bollinger Band
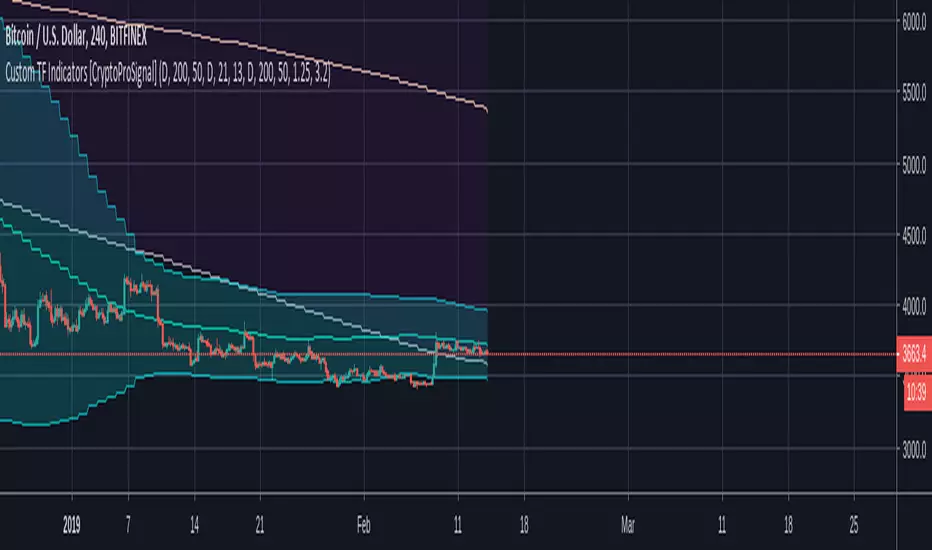
Idea is to plot any of the above indicator with a particular period length from a different timeframe to the timeframe on which you are currently working.
eg : As shown in the chart we have indicator plots from daily timeframe plotted/shown on the current 4hr time frame .
Similarly, you can have indicator plots from 4hr timeframe to be shown on any other timeframe and so on.
Basically you can select plots from any timeframe to work with on any other timeframe of your liking .
Not a rocket science, just play around with it and you will understand :)
1) Simple Moving Average
2) Exponential Moving Average
3) Bollinger Band
Idea is to plot any of the above indicator with a particular period length from a different timeframe to the timeframe on which you are currently working.
eg : As shown in the chart we have indicator plots from daily timeframe plotted/shown on the current 4hr time frame .
Similarly, you can have indicator plots from 4hr timeframe to be shown on any other timeframe and so on.
Basically you can select plots from any timeframe to work with on any other timeframe of your liking .
Not a rocket science, just play around with it and you will understand :)
Release Notes
Minor update : upper and lower plot of BB2 (StdDev1) is now visible by default in case you want to hide the filled color and use it with your other indicators without having confusion of identifying them separately . Also removed those extra cheezy msg lines !Release Notes
Nothing new , just a minor update for code optimiszation .Disclaimer
The information and publications are not meant to be, and do not constitute, financial, investment, trading, or other types of advice or recommendations supplied or endorsed by TradingView. Read more in the Terms of Use.