PROTECTED SOURCE SCRIPT
Economic Events: FOMC, CPI, PPI, NFP, etc
Updated
This script plots vertical lines on major U.S. economic events that can impact a trading day. Allowing you to decide if you want to trade on that day or to help with back testing (limited in how far back one can go).
The indicator preview chart doesn't show the vertical lines for whatever reason.
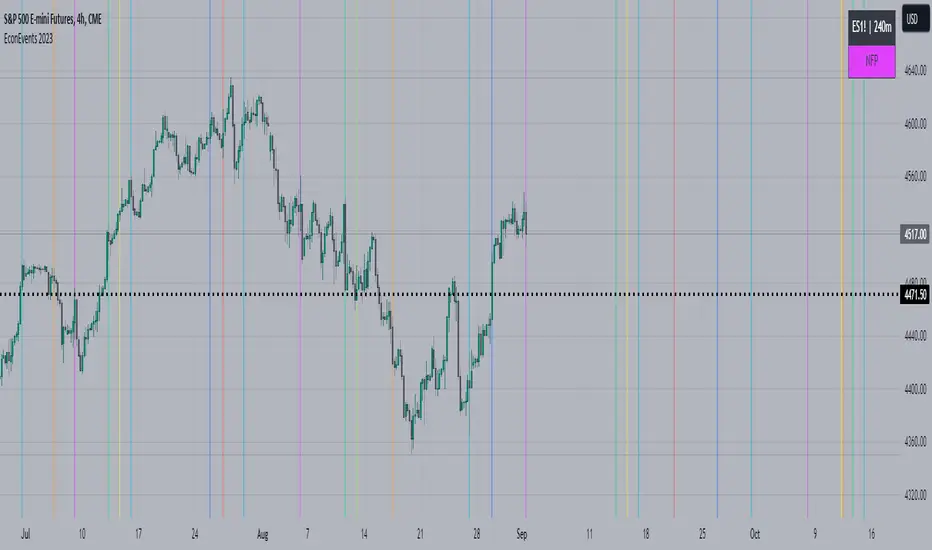
Here is a snapshot image.

This is completely different code from Economic Calendar Events: FOMC, CPI, and more by @jdehorty and uses different logic but provides similar features using the same public library for U.S. economic events.
Differences:
Economic Events
To read a description of the economic events see Economic Calendar Events: FOMC, CPI, and more by @jdehorty
This script uses economic data from Library "EconomicCalendar" and will be updated when said library is updated.
The indicator preview chart doesn't show the vertical lines for whatever reason.
Here is a snapshot image.
This is completely different code from Economic Calendar Events: FOMC, CPI, and more by @jdehorty and uses different logic but provides similar features using the same public library for U.S. economic events.
Differences:
- Substantial Improved Performance.
- Legend setting to only show when there is an event today.
- Abbreviations for events.
- More Legend Settings (Position, Text Size, Color...)
- WARNING: Does NOT use the same 'built-in logic to retroactively adjust larger time intervals', so possible there could be differences but shouldn't be. No noticeable difference on USDJPY.
- Note: Was purposely made to not work on timeframes greater than one day.
Economic Events
- FOMC Meetings
- FOMC Minutes
- Producer Price Index (PPI)
- Consumer Price Index (CPI)
- Consumer Sentiment Index (CSI)
- Consumer Confidence Index (CCI)
- Non-Farm Payroll (NFP)
To read a description of the economic events see Economic Calendar Events: FOMC, CPI, and more by @jdehorty
This script uses economic data from Library "EconomicCalendar" and will be updated when said library is updated.
Release Notes
- Fix horizontal line issues
- Slight performance improvement
Release Notes
The Library "EconomicCalendar" by jdehorty seems to not being updated. The library provided the data events for this indicator.Due to this, this Econ indicator will not be updated (unless situation changes) and this toodegrees Economic Calendar is suggested as an option.

Disclaimer
The information and publications are not meant to be, and do not constitute, financial, investment, trading, or other types of advice or recommendations supplied or endorsed by TradingView. Read more in the Terms of Use.