OPEN-SOURCE SCRIPT
Relative Strength Index with 4 Colors
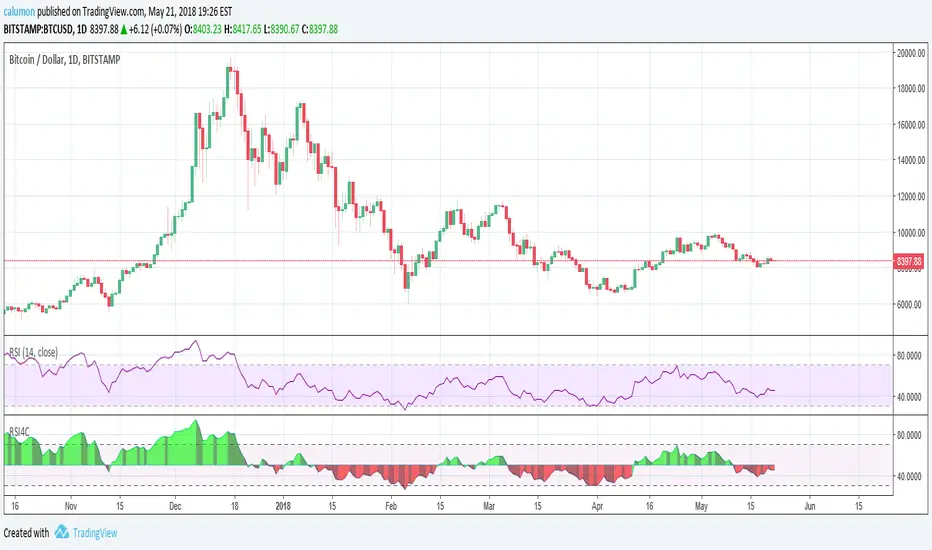
The values used by this indicator are equal to RSI 14. Only changes are made to looks:
If RSI is above 50%, then we are seeing green. Else, we are seeing red.
Another point is that depending on whether the RSI increases or decreases, we get two different color tones.
If RSI is above 50%, then we are seeing green. Else, we are seeing red.
Another point is that depending on whether the RSI increases or decreases, we get two different color tones.
Open-source script
In true TradingView spirit, the creator of this script has made it open-source, so that traders can review and verify its functionality. Kudos to the author! While you can use it for free, remember that republishing the code is subject to our House Rules.
Disclaimer
The information and publications are not meant to be, and do not constitute, financial, investment, trading, or other types of advice or recommendations supplied or endorsed by TradingView. Read more in the Terms of Use.