PROTECTED SOURCE SCRIPT
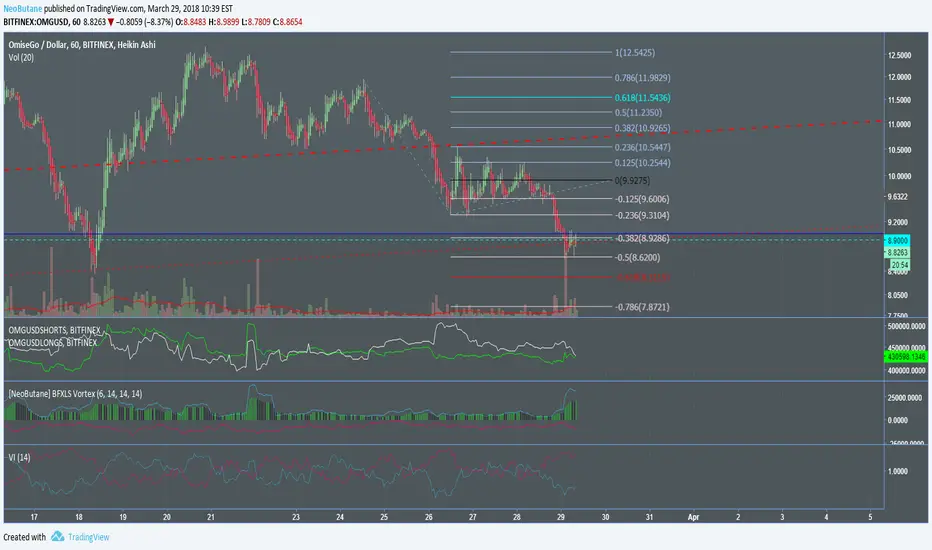
NeoButane Bitfinex BFXLS Vortex Indicator

Scripted longs and shorts to the vortex indicator. It doesn't work like Vortex due to the two plots never crossing to congest.
Blue line: longs
Red line: shorts
Histogram: net volume, ohlc4 of both. Green if previous candle close had lower net volume, black if the previous candle close had more.
Deviance from the histogram: increased volume for the long or short side
Optional ADX line with customizable lookback; it can be difficult to understand due to it being completely horizontal unless you turn off the other plots.
Protected script
This script is published as closed-source. However, you can use it freely and without any limitations – learn more here.
My published indicators: tradingview.com/u/NeoButane/
Sorry if I haven't replied to your message yet, I'm a bit backlogged :)
Sorry if I haven't replied to your message yet, I'm a bit backlogged :)
Disclaimer
The information and publications are not meant to be, and do not constitute, financial, investment, trading, or other types of advice or recommendations supplied or endorsed by TradingView. Read more in the Terms of Use.