OPEN-SOURCE SCRIPT
Average Quarterly and Annual Gain/Loss (Color Divided)
Updated

Hello!
Simple script here!
(BE SURE TO TRY WITH BAR REPLAY)
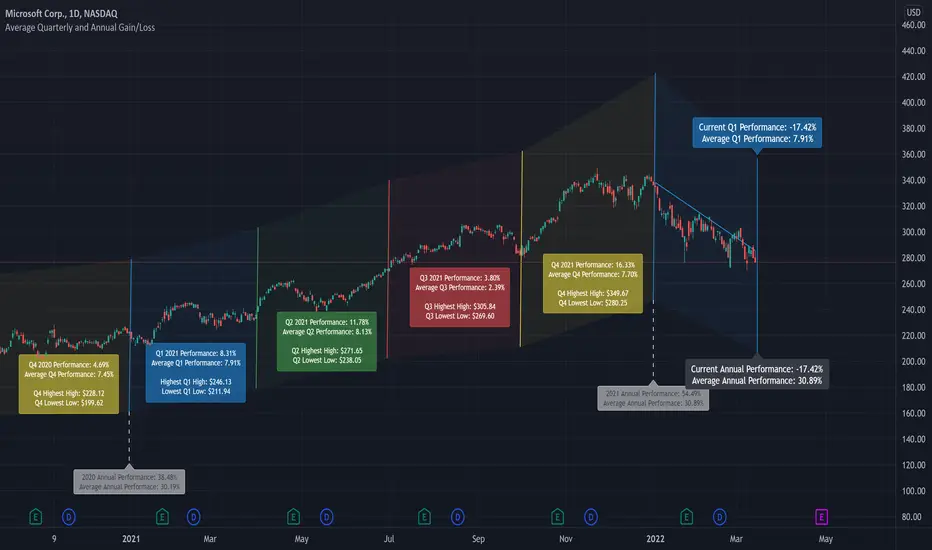
This indicator measures the current quarterly gain/loss (Q1, Q2, Q3, Q4) and the average quarterly gain/loss.
The average percentage gain/loss for Q1, Q2, Q3, and Q4 are calculated and displayed on the chart; colors are adjustable.
By default, Q1 is measured as blue, Q2 as green, Q3 as red and Q4 as yellow.
Also measured is the average annual percentage gain/loss and the current year's running gain/loss.
Years are split by a dashed line, beneath which a label displays that year's percentage gain or loss, in addition to the average annual gain or loss.
Labels and lines update per bar!
A constantly updating line connects the high price of the first session for a quarter to the current high price. The line will delete and restart when a new quarter occurs.
Labels, lines, and line fills are color coded. So, any change to the quarterly/annual color scheme will change the color for all labels, lines, and line fills for that particular quarter!
Thanks for reading!
Release Notes
Made more compatible with low priced assets!Release Notes
Added options to remove lines and labels so only the Quarter divider line fills will show!Also, added timeframe adjustments to make the script more compatible with intrasession timeframes.
Release Notes
Added the highest high and lowest low for each quarter. The script will now detect the highest high for Q1, Q2, Q3, and Q4 in addition to the lowest low for each quarter.Let me know if you would like me to include other measures!
Release Notes
The annual connector dashed-white line will now appear when choosing to hide labels and lines.Release Notes
Script starts at the first year change now!Release Notes
Minor change to source code - fixed a stringRelease Notes
Added tooltips to all the labels displayed on the chart.Hovering over a label displays the corresponding statistics displayed on that label for the S&P 500!
Hopefully, this addition will be useful to position traders hunting for Alpha!
You can compare the current performance of the asset, for the quarter, to the current performance of the S&P 500 for the quarter.
You can also compare the average quarterly performance for the asset to the average quarterly performance for the S&P 500. However, the average quarterly performance metric begins calculating on the start year for the asset on your chart!
You can also compare historical quarter performance of the S&P 500 to historical quarter performance for the asset you are analyzing.
I hope you enjoy the addition and thank you for checking out this script!
Release Notes
Fixed an accidental plotRelease Notes
Fixed one more accidental plotRelease Notes
Added additional performance calculations for the S&P 500 against the asset you are analyzing! The script now calculates the percentage discrepancy between the current quarter and annual return of the asset and the S&P 500 (benchmark).
ibb.co/rvQ97jG
Release Notes
Added an input.symbol option is the user inputs tab that allows you to select a benchmark asset to compare against the performance of the asset on your chart.You can compare the Q1, Q2, Q3, and Q4 gain/loss of any asset that Tradingview provides data for to the asset on your chart! The average quarterly gain and average annual gain will also adjust the asset you select as a benchmark.
Try it out in the user inputs tab!
Release Notes
Group string message addedRelease Notes
Added top right instructions for users who access this script using the search functionRelease Notes
Memory calculation compliantOpen-source script
In true TradingView spirit, the author of this script has published it open-source, so traders can understand and verify it. Cheers to the author! You may use it for free, but reuse of this code in publication is governed by House rules. You can favorite it to use it on a chart.
•Access to Next-Gen Optimization Tools: kiosefftrading.com
•Discord Server: discord.gg/3cKVU28Z9Z
•Discord Server: discord.gg/3cKVU28Z9Z
Disclaimer
The information and publications are not meant to be, and do not constitute, financial, investment, trading, or other types of advice or recommendations supplied or endorsed by TradingView. Read more in the Terms of Use.