OPEN-SOURCE SCRIPT
Price Movement
Updated

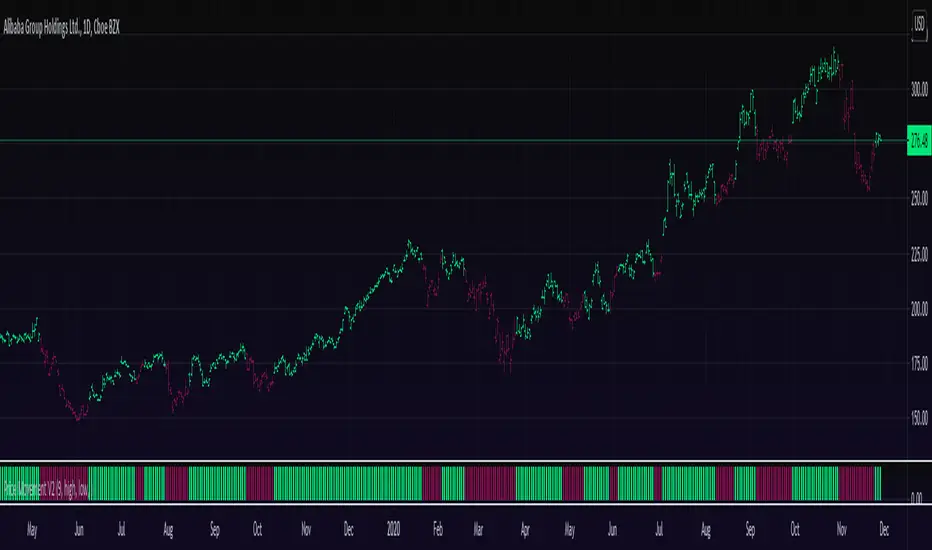
Price indicator that shows the trend based on price movement.
The indicator determinants when an asset price is getting higher or lower by comparing the previous price highs and lows to the current price.
==Explanation==
In case current HL2 [(High +Low)/2] exceeds the previous HL2 HIGH then the columns will turn green.
In case current HL2 fails the previous HL2 LOW then the columns will turn red.
The trick here is that the trend CONTINUES to show the greens and reds, until a reversal happens to the opposite side.
This can be used to determinate trends and reversals.
Note: Bar colors are disabled by default.
You can set the lookback period at the indicator settings as well as the asset source (HL2,CLOSE, etc..). default is HL2
Quote that i like: “It is impossible to produce superior performance unless you do something different from the majority.” – John Templeton
Enjoy and like if you like :)
Release Notes
Minor update in conditions. (removed equal)Release Notes
Added support for HIGHER time frame while default is current time frame. Release Notes
Added Signals in case you want to attach 'Price Movement' indicator into a another indicator. 1 for long, -1 for short.'Close' is now default source input (of course you can change to HL2 or others).
Length was changed to 13 from 17.
Release Notes
Minor fix for additional indicator signals.Release Notes
Changed how Higher time frame is calculated.Release Notes
Minor clean up.Release Notes
FIX: Added High source and Low source.Updated indicator description in script.
You can change 'High Source' and 'Low Source' to different values, like both HL2.
Open-source script
In true TradingView spirit, the author of this script has published it open-source, so traders can understand and verify it. Cheers to the author! You may use it for free, but reuse of this code in publication is governed by House rules. You can favorite it to use it on a chart.
Appreciation of my work: paypal.me/dman103
Premium Pivot Points Algo Indicator: tradingview.com/script/LFBaHNuA-Pivot-Points-Algo/
LIVE Stream - Pivot Points Algo: youtube.com/channel/UCFyqab-i0xb2jf-c18ufH0A/live
Premium Pivot Points Algo Indicator: tradingview.com/script/LFBaHNuA-Pivot-Points-Algo/
LIVE Stream - Pivot Points Algo: youtube.com/channel/UCFyqab-i0xb2jf-c18ufH0A/live
Disclaimer
The information and publications are not meant to be, and do not constitute, financial, investment, trading, or other types of advice or recommendations supplied or endorsed by TradingView. Read more in the Terms of Use.