OPEN-SOURCE SCRIPT
Day ATR H/L + Yesterday H/L + Today H/L - divinechartist
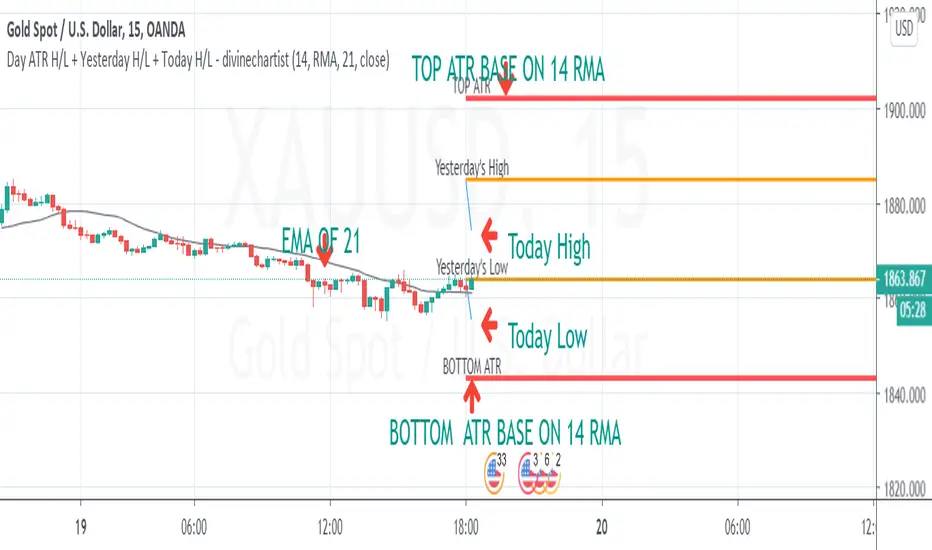
Now you can monitor Yesterday's high and low on a small time frame, You no need to switch time frame every time.
Also, you can monitor support and resistance base on Day's ATR (Default Value is 14)
and also we used EMA of 21 for small-time trand identify.

This indicator helps you to find the best trade near to support and resistance. Using this indicator you can enter in trand with small STOPLOSS and for a BIG PROFIT.
EX :
If your current price is below 21EMA and also broke yesterday's low, so its probability to go more down.
Same, If the price is above 21EMA and the price broke yesterday's high so probability it's going more UP.
Also, you can book profit and set STOPLOSS base on ATR value.
if the price above or near TOP-ATR it's mean it's not the best price to buy, You can book a profit at this price or try to find short sell trade.
Same as if price below BOTTOM-ATR it's mean it's not the best price to sell, You can book a profit at this price or try to find buy trade.
Also, you can monitor support and resistance base on Day's ATR (Default Value is 14)
and also we used EMA of 21 for small-time trand identify.
This indicator helps you to find the best trade near to support and resistance. Using this indicator you can enter in trand with small STOPLOSS and for a BIG PROFIT.
EX :
If your current price is below 21EMA and also broke yesterday's low, so its probability to go more down.
Same, If the price is above 21EMA and the price broke yesterday's high so probability it's going more UP.
Also, you can book profit and set STOPLOSS base on ATR value.
if the price above or near TOP-ATR it's mean it's not the best price to buy, You can book a profit at this price or try to find short sell trade.
Same as if price below BOTTOM-ATR it's mean it's not the best price to sell, You can book a profit at this price or try to find buy trade.
Open-source script
In true TradingView spirit, the author of this script has published it open-source, so traders can understand and verify it. Cheers to the author! You may use it for free, but reuse of this code in publication is governed by House rules. You can favorite it to use it on a chart.
Disclaimer
The information and publications are not meant to be, and do not constitute, financial, investment, trading, or other types of advice or recommendations supplied or endorsed by TradingView. Read more in the Terms of Use.