OPEN-SOURCE SCRIPT
Baz: Mcdx Heatmap
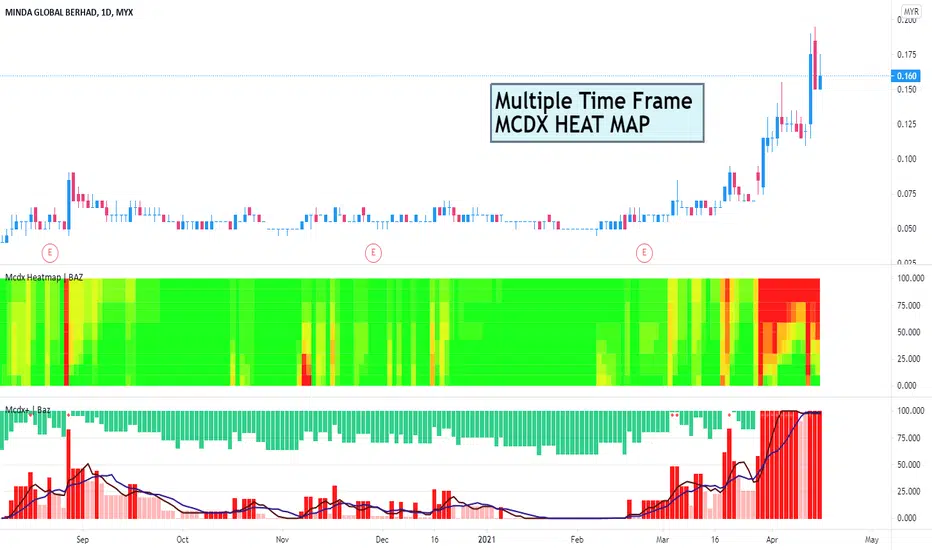
This indicator is to detect buying and selling momentum based on volume and price action with multiple timeframe mcdx.
Improve version of mcdx to let you see clearly real-time changes in 15mins, 30mins, 1h, 2h, 4h, 1D of the mcdx value.
Heatmap:
Green > Yellow > Orange > Red = Retailer shifting to banker
How it works?
The color subsides based on the resolution of chart, for example

We should focus on larger timeframe, which is >50 on the heatmap. Giving a clear signal that banker is still involved.

For value <50 on heatmap, you get faster signal without changing to smaller timeframe getting all the mcdx value, which save us a lot of time to look at bigger picture what is going on.

For example,

Lets check on each timeframe chart, starting from 15mins
For 15mins and 30min chart, mcdx is < 50


For 1H chart, mcdx is about 50

For 2H, 4H 1D, mcdx > 90

Improve version of mcdx to let you see clearly real-time changes in 15mins, 30mins, 1h, 2h, 4h, 1D of the mcdx value.
Heatmap:
Green > Yellow > Orange > Red = Retailer shifting to banker
How it works?
The color subsides based on the resolution of chart, for example
We should focus on larger timeframe, which is >50 on the heatmap. Giving a clear signal that banker is still involved.
For value <50 on heatmap, you get faster signal without changing to smaller timeframe getting all the mcdx value, which save us a lot of time to look at bigger picture what is going on.
For example,
Lets check on each timeframe chart, starting from 15mins
For 15mins and 30min chart, mcdx is < 50
For 1H chart, mcdx is about 50
For 2H, 4H 1D, mcdx > 90
Auto_kk
Open-source script
In true TradingView spirit, the author of this script has published it open-source, so traders can understand and verify it. Cheers to the author! You may use it for free, but reuse of this code in publication is governed by House rules. You can favorite it to use it on a chart.
Disclaimer
The information and publications are not meant to be, and do not constitute, financial, investment, trading, or other types of advice or recommendations supplied or endorsed by TradingView. Read more in the Terms of Use.