OPEN-SOURCE SCRIPT
Cyatophilum Auto Key Levels
Updated

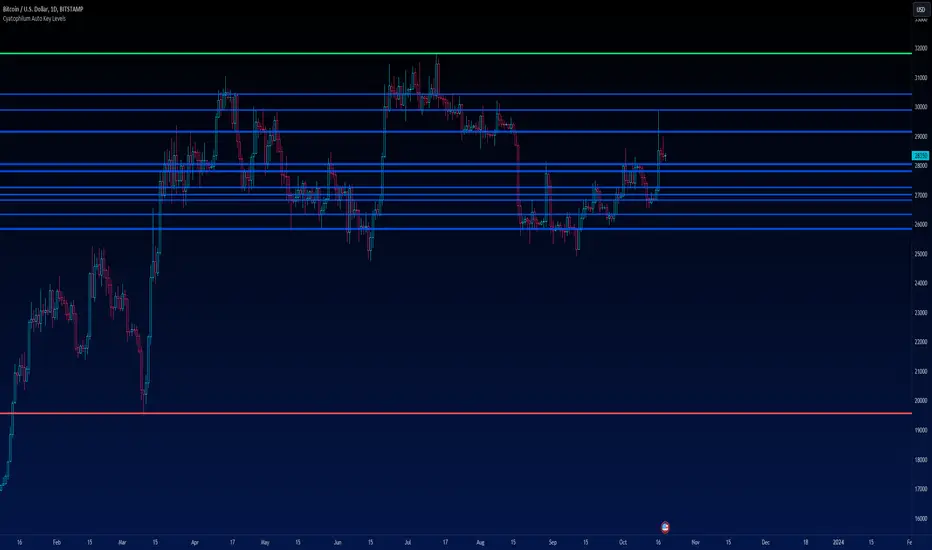
This indicator will automatically plot key horizontal levels.
The script will create a grid from highest to lowest price, dividing this price range into several steps.
It will then loop through each bar and save its cummulative price/volume into each steps.
The steps with the most significant prices/volume are finally plotted into key levels.
═════════════════════════════════════════════════════════════════════════
Settings
• Precision: The number of steps. Increase if you want more precise levels or decrease for bigger areas.
• Lookback: The number of bars from the past used to calculate the levels.
• Strength: The amount of lines to show.
• Use Volume: For volume weighted key levels.
Release Notes
Removed « lookback » parameter. Instead, the script will automatically adapt to the chart's visible bars.The key levels default color is now automatically converted to the high contrast color that fits best the chart's background color. You can still change the color to any color in the inputs.
Release Notes
Added the option to use a lookback for levels calculationRelease Notes
.Release Notes
Updated chartOpen-source script
In true TradingView spirit, the author of this script has published it open-source, so traders can understand and verify it. Cheers to the author! You may use it for free, but reuse of this code in publication is governed by House rules. You can favorite it to use it on a chart.
Want to use this script on a chart?
🔥Get the Cyatophilum Indicators today and automate them on Binance! => blockchainfiesta.com/strategies/
Discord Server: discord.gg/RVwBkpnQzm
I am taking PineScript Commissions ✔
=> blockchainfiesta.com/contact/
Discord Server: discord.gg/RVwBkpnQzm
I am taking PineScript Commissions ✔
=> blockchainfiesta.com/contact/
Disclaimer
The information and publications are not meant to be, and do not constitute, financial, investment, trading, or other types of advice or recommendations supplied or endorsed by TradingView. Read more in the Terms of Use.