INVITE-ONLY SCRIPT
Bitcoin Indicator C
Updated

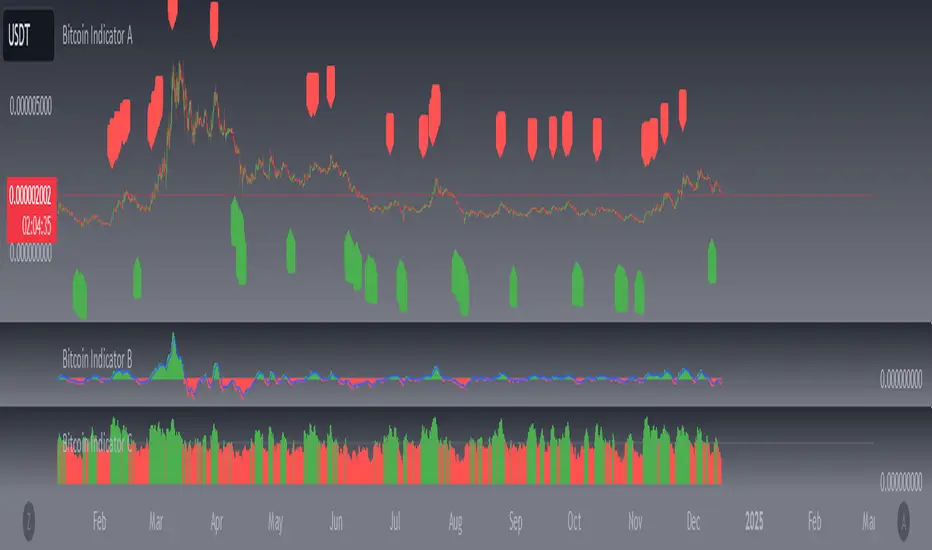
Bitcoin Indicator C is the missing part of the whole picture. It must be used together with Bitcoin Indicator B for the best results possible!
Indicator B is to find the entry on the market sharp, while the new Indicator C will help you to find the zone where it's time to look for the entry. The dots do NOT represent the start nor the end of the trend, they only show the cross of the waves. Indicator C was created to see the bigger picture of the market. You will see 3 waves on the indicator. The white wave is the main indication of the trend, however all of them should be considered together. Think about it as a painting so just step back and watch the whole picture. If you see the waves topping and start to form a downtrend it's time to find your entry on Indicator B. Also when you see waves bottoming it's time to look for the entry of the Long trade.
When all of 3 waves moving together parallel from the top to the bottom that's a strong downtrend. Opposite occurs when there is a strong uptrend on the market.
These waves were created to show unique repeating patterns, too. For example: White wave bottoming while others keep painting on the upside of the zero line. Other example if repeating waves getting lower and lower... Learn more about unique patterns on our website!
Release Notes
"Levels" group added to Inputs.Release Notes
New alerts added.Release Notes
Alert bug fix.Release Notes
Information & chart updated.Release Notes
Multi Timeframe Mode added. This mode will analyze multiple timeframes and create a bigger picture of the market which will help you to identify the main trend.Release Notes
Alert bug fix.Release Notes
This is the biggest update in the life of the Bitcoin Indicator. From now on Indicator C will be used to find Entry Patterns which are the last confirmations before a trade. The whole Bitcoin Indicator got a lot simpler with this update as we removed a lot of useless parts. We also rethinked "The Strategy" which is now very easy to follow.In a nutshell: Set alert for the Signals on Indicator A. Check the chart when you receive the Signal. Decide if it's an Entry Zone on Indicator B and see if there is an Entry Pattern on Indicator C.
Invite-only script
Access to this script is restricted to users authorized by the author and usually requires payment. You can add it to your favorites, but you will only be able to use it after requesting permission and obtaining it from its author. Contact bitcoinindicator for more information, or follow the author's instructions below.
TradingView does not suggest paying for a script and using it unless you 100% trust its author and understand how the script works. In many cases, you can find a good open-source alternative for free in our Community Scripts.
Author's instructions
″Visit the website for the strategy: http://www.bitcoinindicator.co
Want to use this script on a chart?
Warning: please read before requesting access.
Disclaimer
The information and publications are not meant to be, and do not constitute, financial, investment, trading, or other types of advice or recommendations supplied or endorsed by TradingView. Read more in the Terms of Use.