OPEN-SOURCE SCRIPT
Correlation Mandate for Relational Analysis
Updated

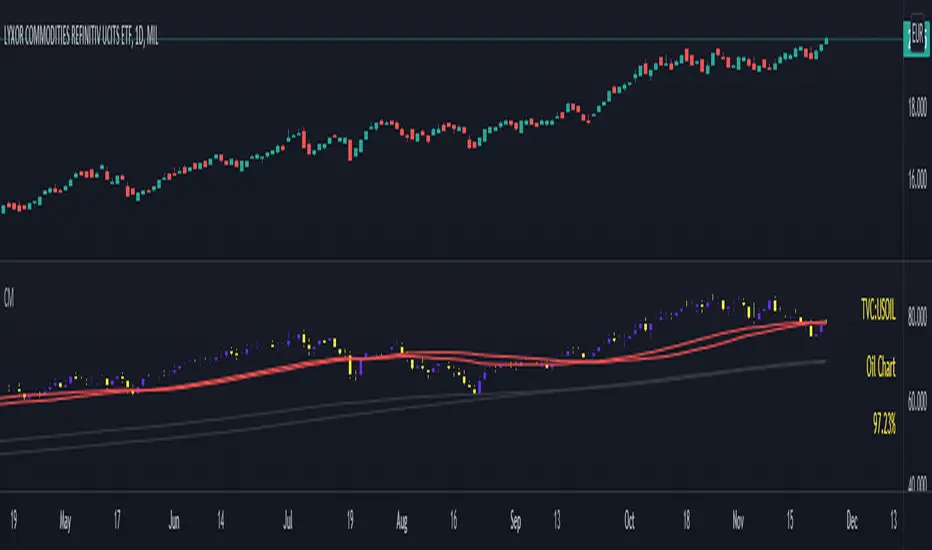
This indicator is engineered to make relational analysis much easier.
If you used another window for each symbol, you would have to resize them all one by one. You don't need another timescale.
There are three modes:
► Independent - selected symbol candles are colored on their own.
► Correlational - selected symbol candles are colored depending on their relation to the chart symbol. If it is correlational, 1st color is chosen (both have Close higher than Open). 2nd color will be used for the opposite.
► Anti-Correlational - the opposite of Correlational
To display my indicator, I chose USDCAD and Oil. Canada has the second-largest oil reserves in the world and naturally, they are their neighbor's supplier. If the oil price goes up, USDCAD should be tanking, unless a different major influence(s) happen to be stronger at a time.
Good luck!
Release Notes
Fixed painting candles when the market is closed.Release Notes
*Release Notes
New functions added• an ability to write your own description of the symbol. For example, if you want to publish an idea and use some less viewed ticker, this might be handy
• built-in calculation for the correlation
• 50 & 200 SMA & EMA
Open-source script
In true TradingView spirit, the author of this script has published it open-source, so traders can understand and verify it. Cheers to the author! You may use it for free, but reuse of this code in publication is governed by House rules. You can favorite it to use it on a chart.
Disclaimer
The information and publications are not meant to be, and do not constitute, financial, investment, trading, or other types of advice or recommendations supplied or endorsed by TradingView. Read more in the Terms of Use.