PROTECTED SOURCE SCRIPT
PAI band (PP & ATR & IV)
Updated
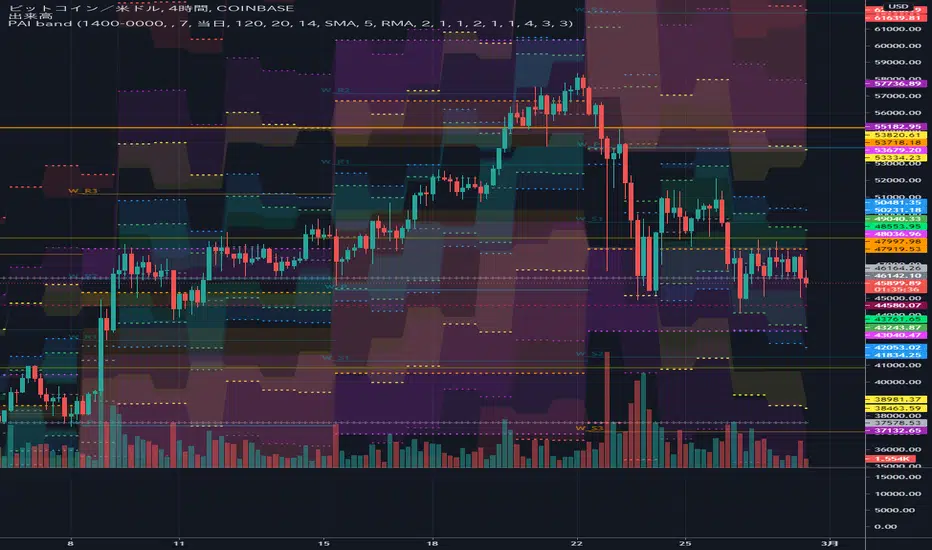
3つの抵抗帯
○インプライド・ボラティリティ
○アベレージ・トゥルー・レンジ
○ピボットポイント
を利用して、日単位・週単位で価格が到達するであろう境界線を表示します。
中途半端な価格帯での狼狽売買を避けて、優位性が期待できる値位置でエントリー・エグジットを検討できます。
価格がPAI bandに到達した時に、あなたが愛用している他のテクニカルのサインと合わせて使うのもいいでしょう。
3 resistance bands
○ Implied volatility
○ Average True Range
○ Pivot point
Use to display the boundaries that the price will reach on a daily/weekly basis.
You can consider entry/exit at a value position where you can expect superiority, avoiding discouragement in the half price range.
When the price reaches the PAI band, you can use it along with other technical signatures that you love.
Release Notes
バンドの表示・非表示を選択できるように改善。バンドの上と下が入れ替わった時に非表示になるように変更。
Improved so that you can choose to show/hide bands.
Changed to hide when the top and bottom of the band are swapped.
Release Notes
ラインの表示・非表示を選択できるように改善。これで、IVのみ、ATRのみの表示も可能。
Improved so that you can choose to show or hide lines.
With this, it is possible to display only IV and only ATR.
Release Notes
特殊なシンボルに対応。(例:1/USDCAD、0.01-USDJPY)
メインのシンボル以外にも設定できるので、比較シンボルのバンド表示も可能。
Supports special symbols.
(Example: 1/USDCAD, 0.01-USDJPY)
Since it can be set to other than the main symbol, band display of comparison symbols is also possible.
Release Notes
IVの代わりにヒストリカルボラティリティ(HV)を選択できるように改善。Improved so that history volatility (HV) can be selected instead of IV.
Release Notes
・日足より長期足で、一日のIV・ATRラインとバンドを非表示。・週足より長期足で、一週のIV・ATRラインとバンドを非表示。
・月初起点の一ヶ月IVラインを延長表示。
・ピボットラインの色と線幅を変更できる。(パラメータ設定画面で)
-----
・The daily IV / ATR line and band are hidden for longer bar than the daily bar.
・The weekly IV / ATR line and band are hidden for longer bar than the weekly bar.
・The one-month IV line starting from the beginning of the month is extended.
・You can change the color and width of the pivot line. (On the parameter setting screen)
Release Notes
1.短い時間足で、長期のピボットが表示されないバグに対応した。(トレーディングビューのバグで、問い合わせ中です)
4時間足未満の月足ピボットと、30分足未満の週足ピボットの描画方法が変わりました。
2.セッション時間を指定できるように変更。
日足・週足のオープン価格を基準にするか、指定したセッション時間を基準にするか選べます。
なお、セッション時間は表示するチャートのブローカーによりGMTかESTか別の基準か変わります。
3.ピボットの平均表示を削除しました。
一つのインジケーターが表示できるラインの制限数を超えたからです。
その他、バグの修正をしました。
-----
1. Fixed a bug where long-term pivots were not displayed in a short time frame.
(We are inquiring about a bug in the trading view)
The drawing method for monthly pivots less than 4 hours and weekly pivots less than 30 minutes has changed.
2. Changed to be able to specify the session time.
You can choose to use the daily / weekly open price as the standard or the specified session time as the standard.
The session time depends on the broker of the chart to be displayed, whether it is GMT or EST or another standard.
3. Removed the average pivot display.
This is because the limit of the number of lines that can be displayed by one indicator has been exceeded.
Other bugs have been fixed.
Disclaimer
The information and publications are not meant to be, and do not constitute, financial, investment, trading, or other types of advice or recommendations supplied or endorsed by TradingView. Read more in the Terms of Use.