INVITE-ONLY SCRIPT
Demand Supply Zone Alerts
Updated
Demand Supply Zone Alert Indicator
This indicator functions as a scanner/screener and is designed to identify symbols with potential demand and supply zones and generate alerts based on your customized settings. It does not visually plot anything on the chart but is used to place alerts.
Key Features:
1. Demand Supply Zone Patterns:
- Drop Base Rally
- Rally Base Rally
- Rally Base Drop
- Drop Base Drop
2. Zoning Methods:
- Wick to Wick: In a demand zone, this method uses the highest high of the basing as the proximal line. For supply zones, it uses the lowest low of the basing.
- Body to Wick: In a demand zone, this method uses the highest body of the basing as the proximal line. For supply zones, it uses the lowest body of the basing.
3. Legin Methods:
- Candle Type: Based on the candle's bullish or bearish structure.
- Candle Color: Uses the candle color to determine the legin, with green indicating a rally and red indicating a drop.
4. Additional Zone Options:
- Follow Through Pattern: Zones with one legout followed by another legout, based on user-defined strength settings.
- Overnight Gap Zones: Zones formed due to overnight gaps after the basing.
- All Demand Supply Zone Structures: Includes all zones, even if they are not considered quality zones.
5. Zone Settings:
- Number of Candles in Basing: Customize the number of candles in the basing phase. For example, setting it to 3 will only identify zones with 3 or fewer basing candles.
- Legout Strength for Single Legout Pattern: Defines how strong a legout candle must be to qualify as a zone.
- Legout Strength for Follow-Through Pattern: Specifies the strength required for two consecutive legout candles to qualify as a follow-through pattern.
Functionality:
The indicator identifies zones based on a three-component structure: legin, basing, and legout. It uses an algorithm that categorizes candles as legin, basing, or legout based on their range compared to the average candle on the chart. Quality zones are defined by legout candles that are significantly larger than the average candle, while basing candles are smaller.
Once a valid zone structure is identified, the indicator will generate an alert from the list of symbols provided in the settings. Alerts will notify users according to their alert notification settings.
Usage Recommendations:
- This indicator works as a real-time scanner or screener to shortlist symbols when a valid zone is formed based on user settings.
- It aids in identifying potential demand and supply zones, but does not provide explicit buy or sell signals.
- Users should integrate this tool with their own trading plan and thoroughly evaluate any identified symbols before making trades.
Limitations:
This indicator does not provide explicit buy or sell signals. It is intended to aid in identifying symbols where demand and supply zones are being created. Users should use this tool in conjunction with their own trade plan and thoroughly evaluate any identified symbols before making any trades.
Disclaimer:
Please ensure you thoroughly evaluate and qualify any identified symbols according to your individual trade plan before making any trades.
Release Notes
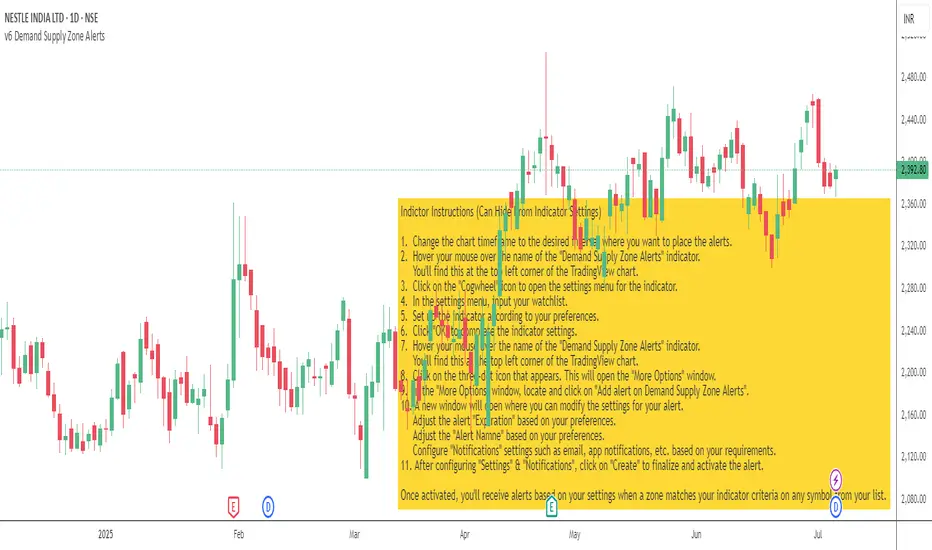
Indicator Instructions updatedInvite-only script
Access to this script is restricted to users authorized by the author and usually requires payment. You can add it to your favorites, but you will only be able to use it after requesting permission and obtaining it from its author. Contact SurjeetKakkar for more information, or follow the author's instructions below.
Please note that this is a private, invite-only script that was not analyzed by script moderators. Its compliance to House Rules is undetermined. TradingView does not suggest paying for a script and using it unless you 100% trust its author and understand how the script works. In many cases, you can find a good open-source alternative for free in our Community Scripts.
Want to use this script on a chart?
Warning: please read before requesting access.
Disclaimer
The information and publications are not meant to be, and do not constitute, financial, investment, trading, or other types of advice or recommendations supplied or endorsed by TradingView. Read more in the Terms of Use.