OPEN-SOURCE SCRIPT
Extended Hour Candle
Updated

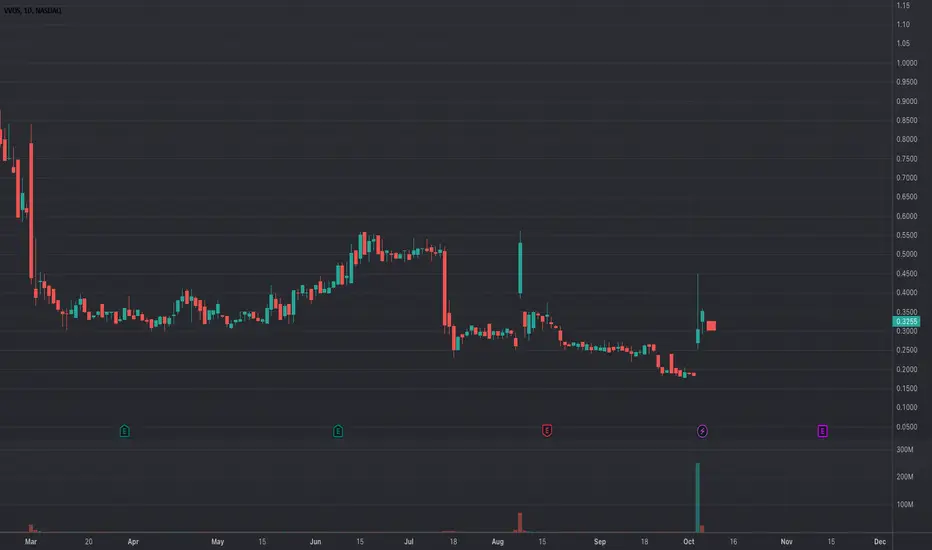
The Extended Hour Candle shows extended hour candle formations on the Daily chart. This indicator can be useful for those who want to analyse price movements during extended trading sessions without switching to intraday charts with "Extended trading hours" enabled.
How to Use:
How to Use:
- Add the Extended Hour Candle indicator to a TradingView chart.
- Adjust the color settings according to personal preferences, using the options to set the desired colors for up and down candles.
- See the Candle during extended trading hours on the Daily chart
Release Notes
v1.1- A small adjustment to properly hide the candle during market hours.
Release Notes
Mistakenly updated the chart. Will be updated again after hours.Release Notes
Update chartOpen-source script
In true TradingView spirit, the author of this script has published it open-source, so traders can understand and verify it. Cheers to the author! You may use it for free, but reuse of this code in publication is governed by House rules. You can favorite it to use it on a chart.
Disclaimer
The information and publications are not meant to be, and do not constitute, financial, investment, trading, or other types of advice or recommendations supplied or endorsed by TradingView. Read more in the Terms of Use.