OPEN-SOURCE SCRIPT
RSI+ by Wilson
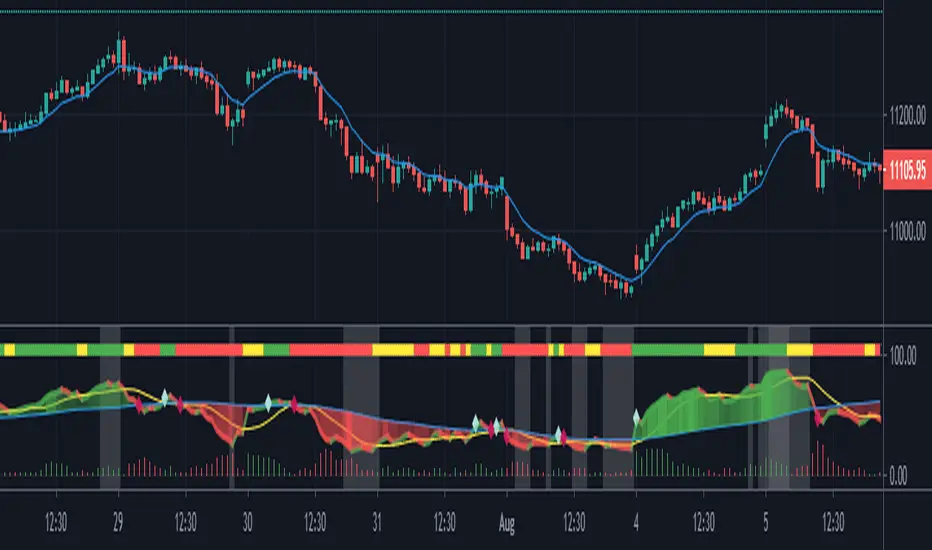
This is a modified version of my RSI Cloud indicator. You can plot 2 moving averages over RSI. You have the option to plot moving average types like SMA, EMA, WMA, VWMA, HullMA, and ALMA. You also have the option to plot histograms based on any of the moving averages. You can fill colors between RSI and moving averages. Option to add alerts, crossover and crossunder signals are also included. I have also included a band to show the position of RSI using three colors. Green color is shown when RSI is above both the plotted moving averages. Red color is shown when RSI is below both the plotted moving averages. And Yellow color is shown when RSI is between the two plotted moving averages. Anyone is free to use the script. Wishing everyone happy and profitable trading.
Open-source script
In true TradingView spirit, the author of this script has published it open-source, so traders can understand and verify it. Cheers to the author! You may use it for free, but reuse of this code in publication is governed by House rules. You can favorite it to use it on a chart.
Disclaimer
The information and publications are not meant to be, and do not constitute, financial, investment, trading, or other types of advice or recommendations supplied or endorsed by TradingView. Read more in the Terms of Use.