PROTECTED SOURCE SCRIPT
ChanLun [AlgoTrader]
Updated
ChanLun, also known as Entanglement Theory or "缠论," is a highly regarded technical analysis methodology that originated in China. Since its introduction in 2006, ChanLun has rapidly gained significant attention and a strong following within the Chinese trader community due to its exceptional ability to navigate complex market dynamics.
ChanLun places great emphasis on market structure, price action, momentum, and the intricate interplay between market forces. It recognizes that the market operates in cyclical patterns and aims to capture the underlying structure and rhythm of price movements. Through meticulous analysis of the intricate relationships between price and time, it provides traders with a unique perspective on market trends, potential reversals, and critical turning points.
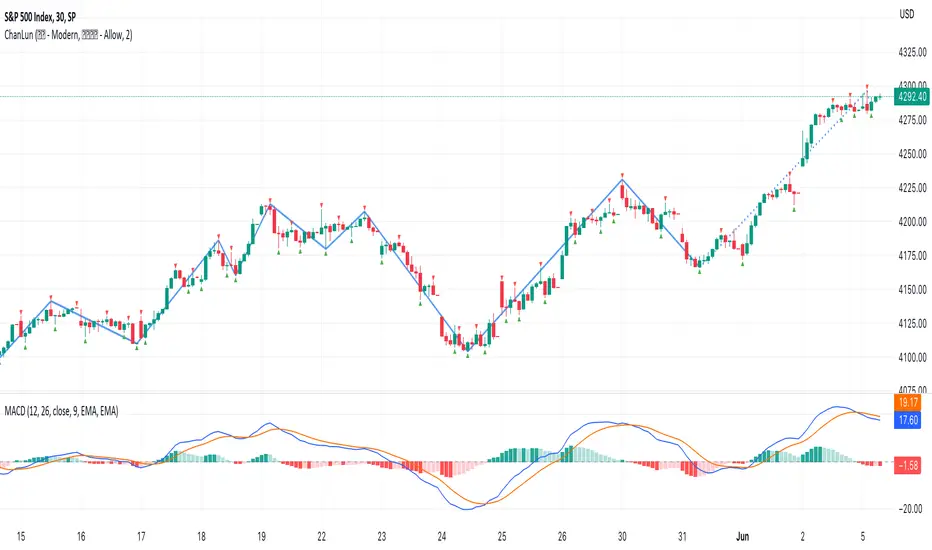
This indicator incorporates three fundamental components of the ChanLun methodology, namely "Candle Standardization," "Fractal," and "Stroke."
- "Candle Standardization" is a process in which the candles are standardized to ensure strict directional consistency and eliminate the presence of inner bars or outer bars.
- "Fractal" refers to the formation of three consecutive "standardized" bars, with the middle bar demonstrating a definitive higher or lower value compared to the bars surrounding it.
- "Stroke" is a line connecting a top fractal and a bottom fractal, subject to the strict condition that there is a minimum of one free bar positioned between them. This requirement ensures that a stroke encompasses a minimum span of five bars from end to end. It is crucial to emphasize that the top fractal consistently maintains a higher value than the bottom fractal.
Within the ChanLun algorithm, these components are processed meticulously and sequentially. The initial step involves candle standardization, where the candles are harmonized to adhere to strict criteria. Subsequently, the identification of fractals takes place by examining the standardized candles. Finally, the stroke component is applied, establishing connections between top and bottom fractals while ensuring the defined conditions are met.
The final component, stroke, enables traders to identify and visualize significant price swings or trends while effectively filtering out minor fluctuations. This functionality proves particularly valuable in recognizing major support and resistance levels, trend reversals, and chart patterns, enhancing the overall analysis process.
__________________________________________________________________________________________________________
本指标严格按照缠论原理实现了三个核心要素,分别为“K线标准化”、“分型”和“笔”。它旨在为缠友们提供准确而可靠的市场分析工具,以在交易中获得更好的表现。
该指标的特色如下:
1. 实时标记分型和笔:本指标具备实时识别和标记分型和笔的功能,以提供清晰的信号和准确的趋势判断。
2. 多种笔算法选择:本指标提供三种不同的笔算法,包括“老笔”、“新笔”和“4K”。这样的设计能够满足不同缠友的个性化需求,让大家根据自己的偏好和策略选择最适合的算法。
3. 自定义颜色:缠友们可以根据自己的喜好和需求,自定义指标的颜色方案。这样的灵活性使得指标能够与图表风格和视觉需求完美匹配。
4. 完美实现K线回放功能:本指标充分利用了K线回放功能,使缠友们能够回顾和分析历史市场数据,从而可以更好地研究和理解市场趋势,提高对市场的洞察力和决策能力。
ChanLun places great emphasis on market structure, price action, momentum, and the intricate interplay between market forces. It recognizes that the market operates in cyclical patterns and aims to capture the underlying structure and rhythm of price movements. Through meticulous analysis of the intricate relationships between price and time, it provides traders with a unique perspective on market trends, potential reversals, and critical turning points.
This indicator incorporates three fundamental components of the ChanLun methodology, namely "Candle Standardization," "Fractal," and "Stroke."
- "Candle Standardization" is a process in which the candles are standardized to ensure strict directional consistency and eliminate the presence of inner bars or outer bars.
- "Fractal" refers to the formation of three consecutive "standardized" bars, with the middle bar demonstrating a definitive higher or lower value compared to the bars surrounding it.
- "Stroke" is a line connecting a top fractal and a bottom fractal, subject to the strict condition that there is a minimum of one free bar positioned between them. This requirement ensures that a stroke encompasses a minimum span of five bars from end to end. It is crucial to emphasize that the top fractal consistently maintains a higher value than the bottom fractal.
Within the ChanLun algorithm, these components are processed meticulously and sequentially. The initial step involves candle standardization, where the candles are harmonized to adhere to strict criteria. Subsequently, the identification of fractals takes place by examining the standardized candles. Finally, the stroke component is applied, establishing connections between top and bottom fractals while ensuring the defined conditions are met.
The final component, stroke, enables traders to identify and visualize significant price swings or trends while effectively filtering out minor fluctuations. This functionality proves particularly valuable in recognizing major support and resistance levels, trend reversals, and chart patterns, enhancing the overall analysis process.
__________________________________________________________________________________________________________
本指标严格按照缠论原理实现了三个核心要素,分别为“K线标准化”、“分型”和“笔”。它旨在为缠友们提供准确而可靠的市场分析工具,以在交易中获得更好的表现。
该指标的特色如下:
1. 实时标记分型和笔:本指标具备实时识别和标记分型和笔的功能,以提供清晰的信号和准确的趋势判断。
2. 多种笔算法选择:本指标提供三种不同的笔算法,包括“老笔”、“新笔”和“4K”。这样的设计能够满足不同缠友的个性化需求,让大家根据自己的偏好和策略选择最适合的算法。
3. 自定义颜色:缠友们可以根据自己的喜好和需求,自定义指标的颜色方案。这样的灵活性使得指标能够与图表风格和视觉需求完美匹配。
4. 完美实现K线回放功能:本指标充分利用了K线回放功能,使缠友们能够回顾和分析历史市场数据,从而可以更好地研究和理解市场趋势,提高对市场的洞察力和决策能力。
Release Notes
- Resolved an issue where the algorithm did not function properly for the GER30 1M chart.────────────────────────────────────────────
- 修复在 GER30 一分钟图上算法异常的问题
Release Notes
- Implemented the "Stroke Correction" algorithm to ensure that the endpoints for each stroke are strictly the highest and lowest points for all the candles (after "standardization/merge") encompassed by the stroke.- Added a new option to limit the number of candles to analyze, which can be used to achieve better script performance.
────────────────────────────────────────────
- 实现“修正笔”算法,以严格确保每笔的起始点和终止点是该笔的所有K线(“标准化 / 包含”处理后)的最高和最低点。
- 新增选项以控制需要分析的历史K线数量。该选项可用来提升脚本性能。
专业缠论指标: alphaviz.pro/chanlun
Email: contact@alphaviz.pro
Discord: discord.gg/w2fFtNega4
Email: contact@alphaviz.pro
Discord: discord.gg/w2fFtNega4
Disclaimer
The information and publications are not meant to be, and do not constitute, financial, investment, trading, or other types of advice or recommendations supplied or endorsed by TradingView. Read more in the Terms of Use.