OPEN-SOURCE SCRIPT
Fib Percentage Previous Day Close
Updated
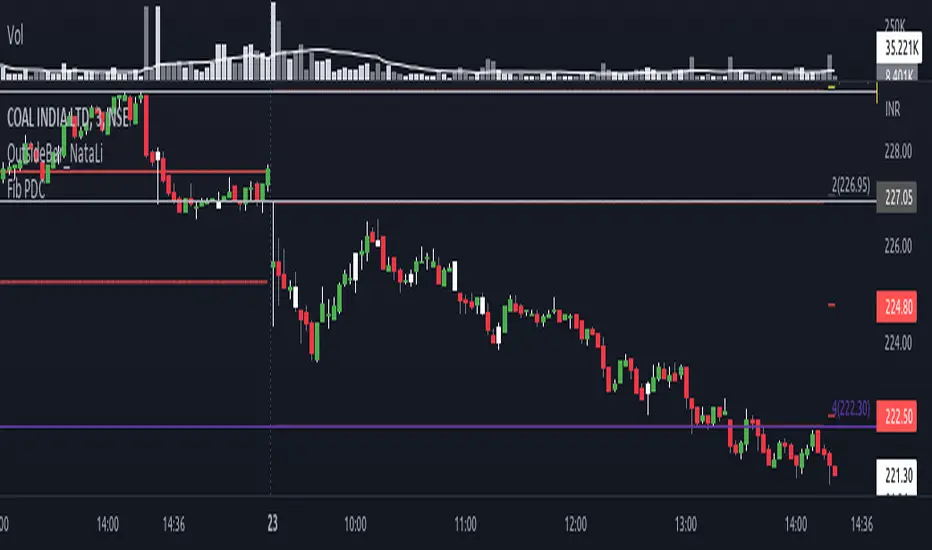
Intraday regulated markets move within their circuit range above or below which the market activity is halted.
These levels are protected by the MM to accumulate or distribute. These levels are mostly same for all markets i.e. 2%, 4% , 5%, 10% and 20% of previous day close, crossing which the market activity halts.
So, from here the expectation of turning or breaking increases.
This indicator automatically plots the levels and helps understanding the price behavior at these points. This in turn helps taking better RR trades.
Release Notes
Updated line 28 from plus sign to minus signRelease Notes
Script was behaving erratically in some instruments. Updated with correctionOpen-source script
In true TradingView spirit, the author of this script has published it open-source, so traders can understand and verify it. Cheers to the author! You may use it for free, but reuse of this code in publication is governed by House rules. You can favorite it to use it on a chart.
Disclaimer
The information and publications are not meant to be, and do not constitute, financial, investment, trading, or other types of advice or recommendations supplied or endorsed by TradingView. Read more in the Terms of Use.