OPEN-SOURCE SCRIPT
Xtrender and TSI Fusion
Updated
Xtrender and TSI Fusion Indicator
I created this indicator for myself. I was inspired by the indicators created by Bjorgum, Duyck and QuantTherapy and decided to create multiple indicators that either work well combined with their indicators or something new that applies some of their indicator concepts. I decided to share all of the indicator I have created because I believe in learning and earing together as a community. If you guys have any questions or suggestions write them.
Overview: The Xtrender and TSI Fusion Indicator is a powerful tool designed to help traders analyze market momentum, trends, and potential reversals. By combining Xtrender with the True Strength Index (TSI), this indicator provides a comprehensive view of market dynamics, making it easier to identify trading opportunities.

Image: Timeframe is set to daily
Features:
1.Xtrender Analysis:
Short-Term Xtrender: Visualizes short-term momentum using RSI-based calculations on EMA differences. This helps in identifying immediate market trends and pullbacks.

Image above: showcases Short-Term Xtrender
Xtrender T3: A smoothed version of the Xtrender that reduces noise and highlights significant trend changes.

Image above: showcases Xtrender T3 with Xtrender T3 color
2.TSI (True Strength Index):
TSI Value: Measures momentum by comparing price changes over two time periods, offering a clear view of trend strength.
TSI Signal Line: A smoothed version of the TSI value, used to generate buy and sell signals when crossed by the TSI.

Image: showcases TSI Value with TSI Signal Line
TSI Histogram: Shows the difference between the TSI and its signal line, highlighting potential reversals and trend continuations.

Image: showcases TSI Histogram
3.Color Coding and Visual Cues:
Trend Colors: The indicator uses dynamic colors to represent bullish or bearish conditions, making it easy to interpret market sentiment.
Background Color: The background changes color based on TSI signals, further aiding in visual trend analysis.

Image: showcases Background color and Zero line
How to Use
1.Xtrender Analysis:
Short-Term Xtrender: The short-term Xtrender is plotted as columns, changing color based on its direction and value. Green or lime indicates positive momentum, while red or maroon indicates negative momentum.
Xtrender T3: The Xtrender T3 line (black) represents a smoothed version of the short-term Xtrender, providing a clearer picture of the overall trend. The color of this line changes based on the Xtrender's value, helping you spot potential trend changes.
2.TSI (True Strength Index):
TSI Value and Signal Line: The TSI value is plotted as a line, with its color changing based on its relationship to the signal line. A crossover of the TSI above the signal line suggests a potential bullish move, while a crossover below indicates a bearish trend.
TSI Histogram: The histogram represents the difference between the TSI and its signal line. Positive values indicate bullish momentum, while negative values suggest bearish momentum.
3.Background Color:
The background color changes based on the TSI signal, with a greenish hue indicating bullish conditions and a reddish hue indicating bearish conditions. This provides a quick visual reference for market sentiment.
4.Zero Line:
A horizontal gray dotted line at the zero level helps you easily identify when the Xtrender or TSI crosses into positive or negative territory, signaling potential trend shifts.

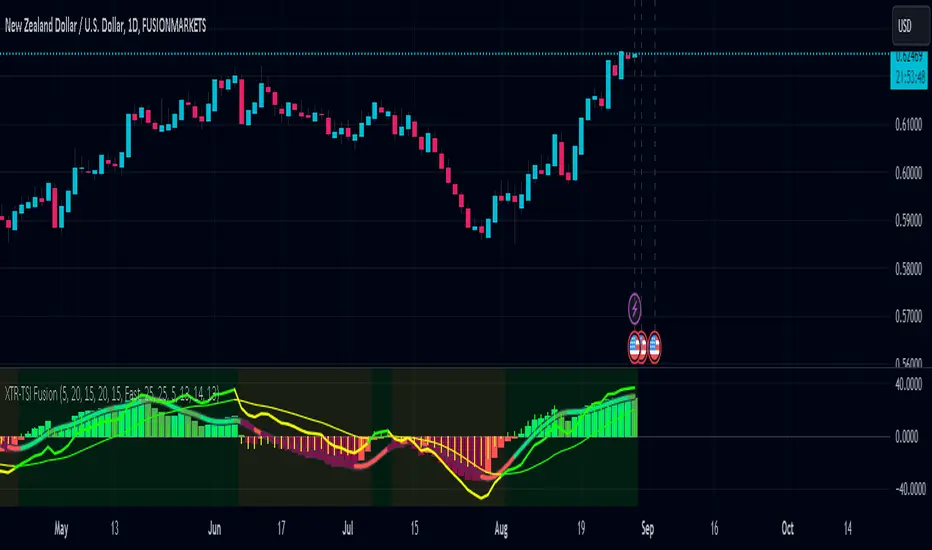
Image above: Timeframe on daily with the individual elements combined
Example of Use:
•Trend Confirmation: Use the Xtrender and Xtrender T3 to confirm the direction of the trend. If both are aligned with the same color and direction, it increases the probability of a strong trend.
•Momentum Reversals: Watch for TSI crosses and histogram shifts to identify potential reversals. For example, a TSI crossover above its signal line with a corresponding change in the histogram from negative to positive could signal a buying opportunity.
•Pullbacks: Identify pullbacks within a trend by observing temporary shifts in the short-term Xtrender or TSI histogram. Use these signals to enter trades in the direction of the overall trend.

Image above: Showcases, Trend confirmation, reversal and pullbacks on daily timeframe.
Customization:
•TSI Speed: Choose between "Fast" and "Slow" TSI settings based on your trading style. Fast settings are more responsive to price changes, while slow settings offer smoother signals.
•Color Settings: Customize the colors for bullish, bearish, and neutral TSI conditions to match your personal preferences or chart theme.
This indicator is versatile and can be used for various trading strategies, from trend following to momentum trading, making it a valuable tool in any trader's arsenal.
My Scripts/Indicators/Ideas /Systems that I share are only for educational purposes
I created this indicator for myself. I was inspired by the indicators created by Bjorgum, Duyck and QuantTherapy and decided to create multiple indicators that either work well combined with their indicators or something new that applies some of their indicator concepts. I decided to share all of the indicator I have created because I believe in learning and earing together as a community. If you guys have any questions or suggestions write them.
Overview: The Xtrender and TSI Fusion Indicator is a powerful tool designed to help traders analyze market momentum, trends, and potential reversals. By combining Xtrender with the True Strength Index (TSI), this indicator provides a comprehensive view of market dynamics, making it easier to identify trading opportunities.
Image: Timeframe is set to daily
Features:
1.Xtrender Analysis:
Short-Term Xtrender: Visualizes short-term momentum using RSI-based calculations on EMA differences. This helps in identifying immediate market trends and pullbacks.
Image above: showcases Short-Term Xtrender
Xtrender T3: A smoothed version of the Xtrender that reduces noise and highlights significant trend changes.
Image above: showcases Xtrender T3 with Xtrender T3 color
2.TSI (True Strength Index):
TSI Value: Measures momentum by comparing price changes over two time periods, offering a clear view of trend strength.
TSI Signal Line: A smoothed version of the TSI value, used to generate buy and sell signals when crossed by the TSI.
Image: showcases TSI Value with TSI Signal Line
TSI Histogram: Shows the difference between the TSI and its signal line, highlighting potential reversals and trend continuations.
Image: showcases TSI Histogram
3.Color Coding and Visual Cues:
Trend Colors: The indicator uses dynamic colors to represent bullish or bearish conditions, making it easy to interpret market sentiment.
Background Color: The background changes color based on TSI signals, further aiding in visual trend analysis.
Image: showcases Background color and Zero line
How to Use
1.Xtrender Analysis:
Short-Term Xtrender: The short-term Xtrender is plotted as columns, changing color based on its direction and value. Green or lime indicates positive momentum, while red or maroon indicates negative momentum.
Xtrender T3: The Xtrender T3 line (black) represents a smoothed version of the short-term Xtrender, providing a clearer picture of the overall trend. The color of this line changes based on the Xtrender's value, helping you spot potential trend changes.
2.TSI (True Strength Index):
TSI Value and Signal Line: The TSI value is plotted as a line, with its color changing based on its relationship to the signal line. A crossover of the TSI above the signal line suggests a potential bullish move, while a crossover below indicates a bearish trend.
TSI Histogram: The histogram represents the difference between the TSI and its signal line. Positive values indicate bullish momentum, while negative values suggest bearish momentum.
3.Background Color:
The background color changes based on the TSI signal, with a greenish hue indicating bullish conditions and a reddish hue indicating bearish conditions. This provides a quick visual reference for market sentiment.
4.Zero Line:
A horizontal gray dotted line at the zero level helps you easily identify when the Xtrender or TSI crosses into positive or negative territory, signaling potential trend shifts.
Image above: Timeframe on daily with the individual elements combined
Example of Use:
•Trend Confirmation: Use the Xtrender and Xtrender T3 to confirm the direction of the trend. If both are aligned with the same color and direction, it increases the probability of a strong trend.
•Momentum Reversals: Watch for TSI crosses and histogram shifts to identify potential reversals. For example, a TSI crossover above its signal line with a corresponding change in the histogram from negative to positive could signal a buying opportunity.
•Pullbacks: Identify pullbacks within a trend by observing temporary shifts in the short-term Xtrender or TSI histogram. Use these signals to enter trades in the direction of the overall trend.
Image above: Showcases, Trend confirmation, reversal and pullbacks on daily timeframe.
Customization:
•TSI Speed: Choose between "Fast" and "Slow" TSI settings based on your trading style. Fast settings are more responsive to price changes, while slow settings offer smoother signals.
•Color Settings: Customize the colors for bullish, bearish, and neutral TSI conditions to match your personal preferences or chart theme.
This indicator is versatile and can be used for various trading strategies, from trend following to momentum trading, making it a valuable tool in any trader's arsenal.
My Scripts/Indicators/Ideas /Systems that I share are only for educational purposes
Release Notes
Update:- Added bar coloring based on the TSI and Xtrender
Explanation:
barColor Calculation
The bar color is determined by both the TSI and Xtrender values:
color lime when both TSI is above its signal line and shortTermXtrender is positive.
color red when both TSI is below its signal line and shortTermXtrender is negative.
color orange when TSI is above its signal line but shortTermXtrender is negative.
color blue when TSI is below its signal line but shortTermXtrender is positive.
barcolor Function:
barcolor applies the calculated barColor to the chart bars.
This addition colors the bars on your chart according to the combined signals from the TSI and Xtrender, providing a visual indication of the current market conditions.
Release Notes
Image above: Xtrender and TSI Fusion bar color Update
Open-source script
In true TradingView spirit, the author of this script has published it open-source, so traders can understand and verify it. Cheers to the author! You may use it for free, but reuse of this code in publication is governed by House rules. You can favorite it to use it on a chart.
Disclaimer
The information and publications are not meant to be, and do not constitute, financial, investment, trading, or other types of advice or recommendations supplied or endorsed by TradingView. Read more in the Terms of Use.