INVITE-ONLY SCRIPT
[KRONOS] Flow

Description
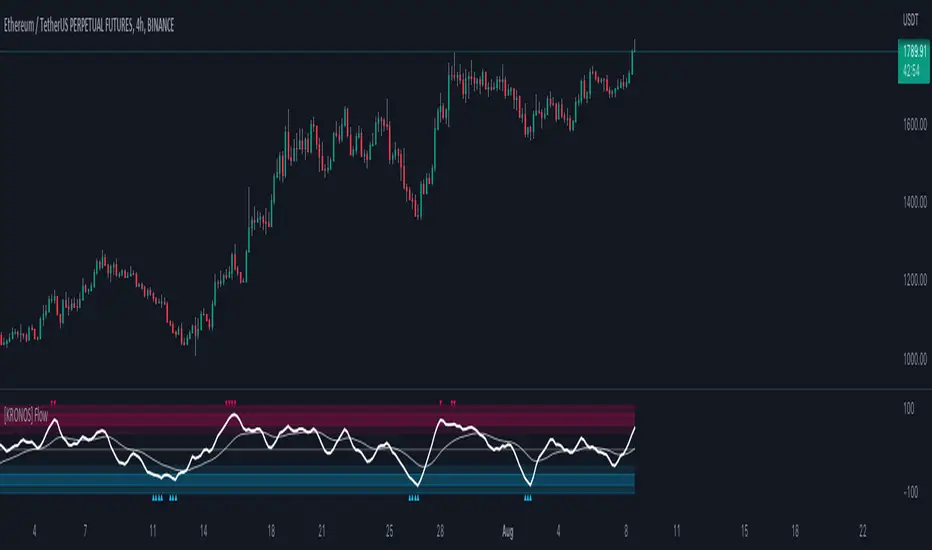
The main indicator component is a white signal line calculated from the price and strength of the current market pair filtered using the Fourier transformation formula (by Joseph Fourier).
It includes
Trend confirmation. The grayish line is the signal line moving average which can either be used as a support/resistance line or as a strong trend confirmation in the case of a crossover/crossunder.
Oversold and overbought areas. These areas are marked with multiple hues of red and blue color for them to be more easily noticeable.
Extreme areas. Arrows around extreme areas are showing points where a reversal is very likely to occur.
How to use?
Buy/Long on a blue arrow (or after a crossover if you want more confirmations)
Sell/Short on a red arrow (or after a crossunder if you want more confirmations)
extra tip: use the zero line and overbought/oversold areas as a take profit area and place your stop loss at the previous swing low.
Invite-only script
Access to this script is restricted to users authorized by the author and usually requires payment. You can add it to your favorites, but you will only be able to use it after requesting permission and obtaining it from its author. Contact kronos-algo for more information, or follow the author's instructions below.
TradingView does not suggest paying for a script and using it unless you 100% trust its author and understand how the script works. In many cases, you can find a good open-source alternative for free in our Community Scripts.
Author's instructions
″Learn more at: https://kronos-trading.com/indicators
Our indicators are suitable for all markets: Crypto, Forex, stocks, etc.
Want to use this script on a chart?
Warning: please read before requesting access.
Learn more at: kronos-trading.com/indicators
Our indicators are suitable for all markets: Crypto, Forex, stocks, etc.
Our indicators are suitable for all markets: Crypto, Forex, stocks, etc.
Disclaimer
The information and publications are not meant to be, and do not constitute, financial, investment, trading, or other types of advice or recommendations supplied or endorsed by TradingView. Read more in the Terms of Use.