OPEN-SOURCE SCRIPT
CM Willams %R and CCI BackGround Highlight
CM_Willams %R and CCI BackGround Highlight
Created By User Request
Indicator Highlights:
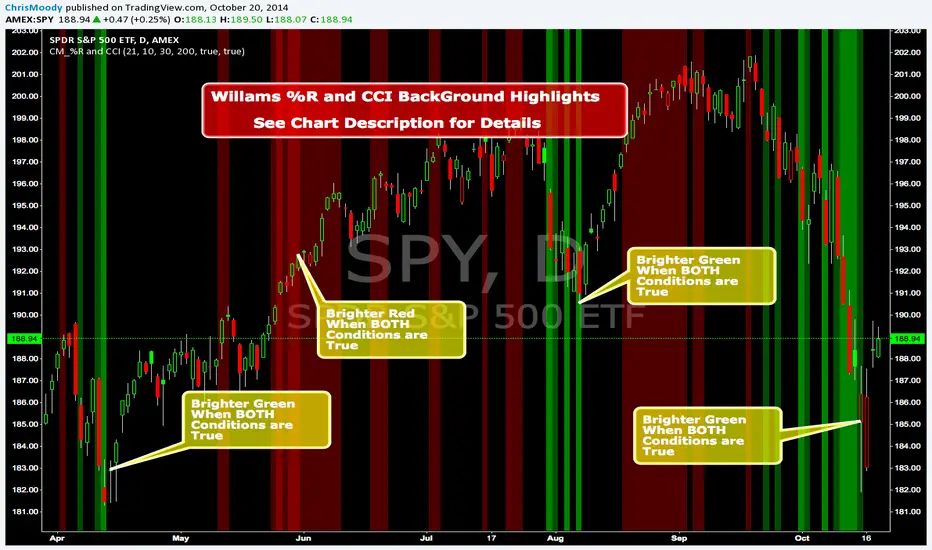
Creates Red BackGround Highlight if CCI Or Williams %R are Above Upper Line (User Defined)
Creates Green BackGround Highlight if CCI Or Williams %R are Below Lower Line (User Defined)
Ability to Turn On/Off either Williams %R or CCI Highlights in Inputs Tab via Check Boxes.
Ability To Set All Parameters for CCI and Williams %R in Inputs Tab.
Ability to Set High/Low “Threshold” Lines for Both CCI and Williams %R in Inputs Tab.
***I was asked if you could plot Back Ground Highlights on Two Individual Indicators AND have it show if BOTH Indicators were Overbought and Oversold.
***The answer is Yes. On the Chart Above I have the same Shade of Red and Green for Both Indicators. However, you will notice when Both Indicators Show OverBought…Both Plot Red Back Ground Highlights Which = a Brighter Red. The same is True for Oversold Conditions. The Green Shows a Brighter Shade of Green.
***VERY IMPORTANT - It is difficult for a programmer to release Indicators with this feature because depending on what color background you use on your charts…THE COLORS LOOK COMPLETELY DIFFERENT. So If You Don’t Use The Black Back Ground Shown Above You Most Likely Will Need To Adjust The Transparency, and Possibly The Colors Themselves!!!!
Reference Page
tradingview.com/v/UmsFo3hv/
Created By User Request
Indicator Highlights:
Creates Red BackGround Highlight if CCI Or Williams %R are Above Upper Line (User Defined)
Creates Green BackGround Highlight if CCI Or Williams %R are Below Lower Line (User Defined)
Ability to Turn On/Off either Williams %R or CCI Highlights in Inputs Tab via Check Boxes.
Ability To Set All Parameters for CCI and Williams %R in Inputs Tab.
Ability to Set High/Low “Threshold” Lines for Both CCI and Williams %R in Inputs Tab.
***I was asked if you could plot Back Ground Highlights on Two Individual Indicators AND have it show if BOTH Indicators were Overbought and Oversold.
***The answer is Yes. On the Chart Above I have the same Shade of Red and Green for Both Indicators. However, you will notice when Both Indicators Show OverBought…Both Plot Red Back Ground Highlights Which = a Brighter Red. The same is True for Oversold Conditions. The Green Shows a Brighter Shade of Green.
***VERY IMPORTANT - It is difficult for a programmer to release Indicators with this feature because depending on what color background you use on your charts…THE COLORS LOOK COMPLETELY DIFFERENT. So If You Don’t Use The Black Back Ground Shown Above You Most Likely Will Need To Adjust The Transparency, and Possibly The Colors Themselves!!!!
Reference Page
tradingview.com/v/UmsFo3hv/
Open-source script
In true TradingView spirit, the creator of this script has made it open-source, so that traders can review and verify its functionality. Kudos to the author! While you can use it for free, remember that republishing the code is subject to our House Rules.
For quick access on a chart, add this script to your favorites — learn more here.
Coming Soon: ChrisMoodyTrading.com
Disclaimer
The information and publications are not meant to be, and do not constitute, financial, investment, trading, or other types of advice or recommendations supplied or endorsed by TradingView. Read more in the Terms of Use.