OPEN-SOURCE SCRIPT
Abnormal bar % v.1
Updated

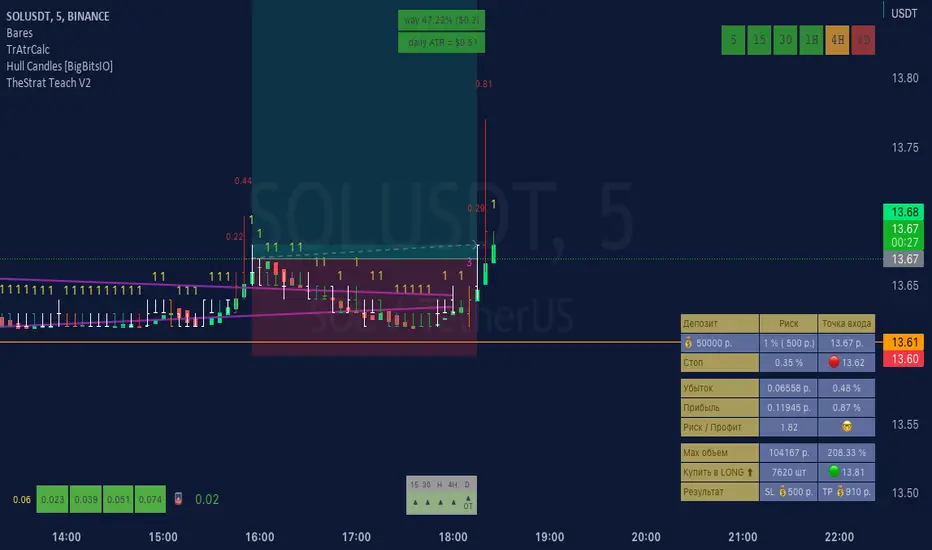
This script helps you find abnormal bars on the charts.
An abnormal bar is a bar that is larger than the adjacent bar by at least 50 percent.
The script can search for bars on any time frame.
The search for an abnormal bar, is possible in two ways:
- on the absolute value, for example - all that is higher than 0.5% is considered an abnormal bar, on different timeframes it is necessary to change the percentage values;
- on the basis of the ATR, in my opinion it is a more objective result.
In the settings available:
- choice of color to display percentages on the screen;
- choice of calculation method;
- Selecting the value - what is considered an abnormal bar.
======
Данный скрипт помогает найти на графиках аномальные бары.
Аномальный бар - это бар который, больше рядом стоящего бара как минимум на 50 процентов.
Скрипт может искать бары на любом тайм-фрейма.
Поиск аномального бара, возможен в двух вариантах:
- по абсолютному значению, например - всё что выше 0.5%, считается аномальным баром, на разных тайм-фреймах нужно менять значения процентов;
- на основание ATR, на мой взгляд это более объективный результат.
В настройках доступно:
- выбор цвета для отображения процентов на экране;
- выбор способа поиска;
- выбор значения - что считаем аномальным баром.
==
Release Notes
FixChanges have been made in the calculations.
1. By default, the abnormal bar is a bar that is > 50%.
2. For a better analysis - the values of abnormal bars are highlighted in different colores and font size.
Release Notes
Updated:A choice of three data display modes is available:
- double
- ATR
- absolut
A tooltip when hovering over the data.
====
Обновлено:
Доступен выбор из трех режимов отображения данных:
- double
- ATR
- absolut
Всплывающая подсказка при наведении на данные.
Release Notes
Update1 The design, methods and ways of calculation have been redesigned.
2 Added module showing ATR
_________
Переделан дизайн, методы и способы расчета.
Добавлен модуль показывающий ATR
Release Notes
Fix problemsRelease Notes
update- moving averages (10, 20, 50, 100, 200) added
- progress ATR of each new candle, on the current time frame
==============
обновление
- добавлены скользящие средние (10, 20, 50, 100, 200)
- прогресс ATR каждой новой свечи, на текущем тайм-фрейме
Release Notes
Fix problemRelease Notes
updatevolatility rise signal added on ticker
========
обновление
добавлен сигнал на рост волатильности
Release Notes
Небольшие правкиRelease Notes
updateOpen-source script
In true TradingView spirit, the author of this script has published it open-source, so traders can understand and verify it. Cheers to the author! You may use it for free, but reuse of this code in publication is governed by House rules. You can favorite it to use it on a chart.
Disclaimer
The information and publications are not meant to be, and do not constitute, financial, investment, trading, or other types of advice or recommendations supplied or endorsed by TradingView. Read more in the Terms of Use.