OPEN-SOURCE SCRIPT
Boom Hunter
Updated

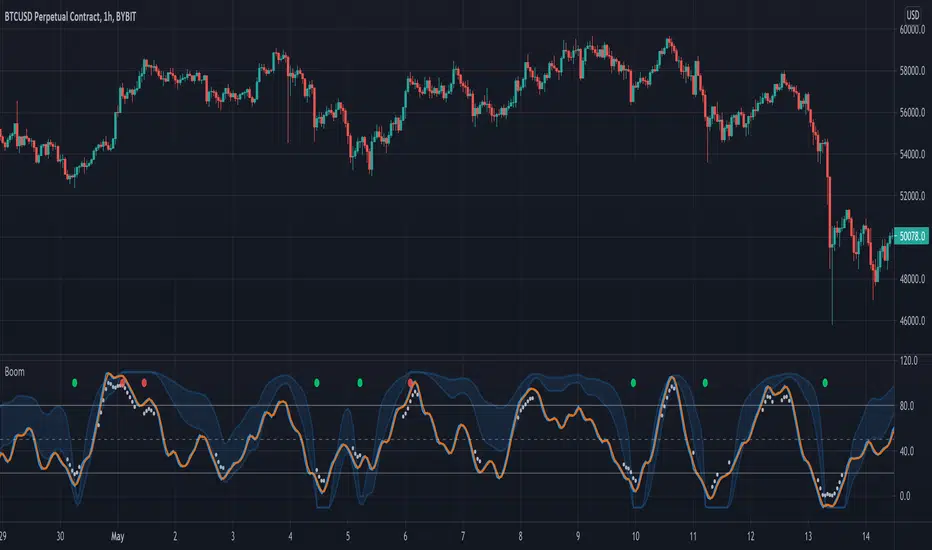
Every "boom" begins with a pullback... This indicator will help traders find bottoms and perfect entries into a pump. It combines two indicators, Dr. John Ehlers Early Onset Trend (EOT) and the infamous Stochastic RSI. The indicator features a built in dump and dip detector which usually picks up signals a few candles before it happens. The blue wave (EOT) shows trend, when waves travel up so does the price. Likewise for the opposite. Low points are revealed when EOT bottoms out and flat lines. Traders can then use the Stochastic RSI crossover to enter a trade. As the EOT lines get closer together there is more movement in price action, so as they get wider traders can expect sideways action. This indicator works on all timeframes but has had excellent results on hourly chart.
Entry zones are marked with a green dot at top of indicator. This signals a bottom is being formed and traders should look for an entry.
Exit points are marked with a red dot at top of indicator. This signals a peak and great time to exit.
Dips and dumps are indicated in red at bottom of indicator.
Entry zones are marked with a green dot at top of indicator. This signals a bottom is being formed and traders should look for an entry.
Exit points are marked with a red dot at top of indicator. This signals a peak and great time to exit.
Dips and dumps are indicated in red at bottom of indicator.
Release Notes
- Added MA filter option for dump detector. With the filter on, only dumps in uptrend are detected. Removing filter will show all dump signals and may be a "spammy"
Release Notes
Added alerts for buy point and sell pointRelease Notes
Boom Hunter now has a new theme and default look using classic trading view colors. 2 new oscillators have been added and can be changed in settings:
- Stochastic RSI
- Stochastic RVI
- LSMA Wave Trend (Default)
Above shows oscillators.
Above shows available themes.
Above shows an example of different LSMA lengths.
Above shows an example of different WT settings.
By tuning the settings for your timeframe and chart your oscillator can either scalp waves or ride trends.
Open-source script
In true TradingView spirit, the author of this script has published it open-source, so traders can understand and verify it. Cheers to the author! You may use it for free, but reuse of this code in publication is governed by House rules. You can favorite it to use it on a chart.
Disclaimer
The information and publications are not meant to be, and do not constitute, financial, investment, trading, or other types of advice or recommendations supplied or endorsed by TradingView. Read more in the Terms of Use.