PROTECTED SOURCE SCRIPT
Daye @joshuuu
Updated
This indicator is based on Dayes studies about 90minute cycles and true opens.
Similar to how ICT teaches the true day open at 0.00, Daye came up with his true year, true month, true week and true session opens.
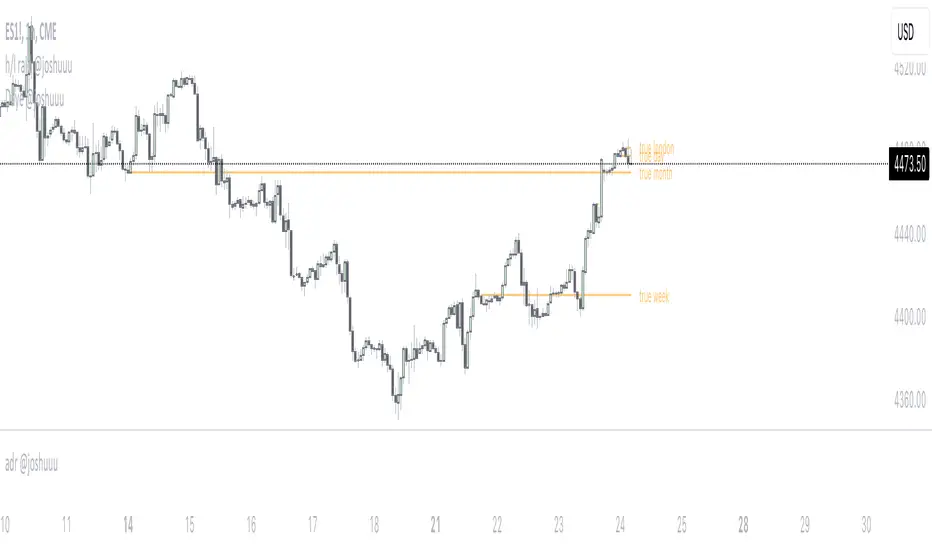
True Year - April 1st
True Month - 2nd Monday
True Week - Monday, 6pm
True Day - 12am (Midnight)
True Session - 1:30am (London), 7:30am (New York), 1:30pm (Afternoon)
Ideally, for a bearish scenario, we would like to see price trade above the opening price to then reverse and trade lower.
Ideally, for a bullish scenario, we would like to see price trade below the opening price to then reverse and trade higher.
The moves into the opposite direction are used my smart money to accumulate their positions and trap traders into wrong positions.
This indicator also shows 90 minutes cycles.
90min Cycle Cheat Sheet:
Q1. (A)ccumulation - Consolidation
Q2. (M)anipulation - Judas Swing (Trade this)
Q3. (D)istribution - LRLR (Trade this)
Q4. (X) - Continuation/Reversal of previous q.
Or
Q1. (X) - Continuation/Reversal of previous q.
Q2. (A)ccumulation - Consolidation
Q3. (M)anipulation - Judas Swing (Trade this)
Q4. (D)istribution - LRLR (Trade this)
This shows that if q1 consolidates and q2 takes out one side and reverses we anticipate q3 to have a strong move.
however, if q2 consolidates, we anticipate q3 to take out one side, reverse and then have a strong move in q4.
Similar to how ICT teaches the true day open at 0.00, Daye came up with his true year, true month, true week and true session opens.
True Year - April 1st
True Month - 2nd Monday
True Week - Monday, 6pm
True Day - 12am (Midnight)
True Session - 1:30am (London), 7:30am (New York), 1:30pm (Afternoon)
Ideally, for a bearish scenario, we would like to see price trade above the opening price to then reverse and trade lower.
Ideally, for a bullish scenario, we would like to see price trade below the opening price to then reverse and trade higher.
The moves into the opposite direction are used my smart money to accumulate their positions and trap traders into wrong positions.
This indicator also shows 90 minutes cycles.
90min Cycle Cheat Sheet:
Q1. (A)ccumulation - Consolidation
Q2. (M)anipulation - Judas Swing (Trade this)
Q3. (D)istribution - LRLR (Trade this)
Q4. (X) - Continuation/Reversal of previous q.
Or
Q1. (X) - Continuation/Reversal of previous q.
Q2. (A)ccumulation - Consolidation
Q3. (M)anipulation - Judas Swing (Trade this)
Q4. (D)istribution - LRLR (Trade this)
This shows that if q1 consolidates and q2 takes out one side and reverses we anticipate q3 to have a strong move.
however, if q2 consolidates, we anticipate q3 to take out one side, reverse and then have a strong move in q4.
Release Notes
fixed true month openautomatically hides 90 mins cycles above hourly timeframe
Release Notes
--Disclaimer
The information and publications are not meant to be, and do not constitute, financial, investment, trading, or other types of advice or recommendations supplied or endorsed by TradingView. Read more in the Terms of Use.