OPEN-SOURCE SCRIPT
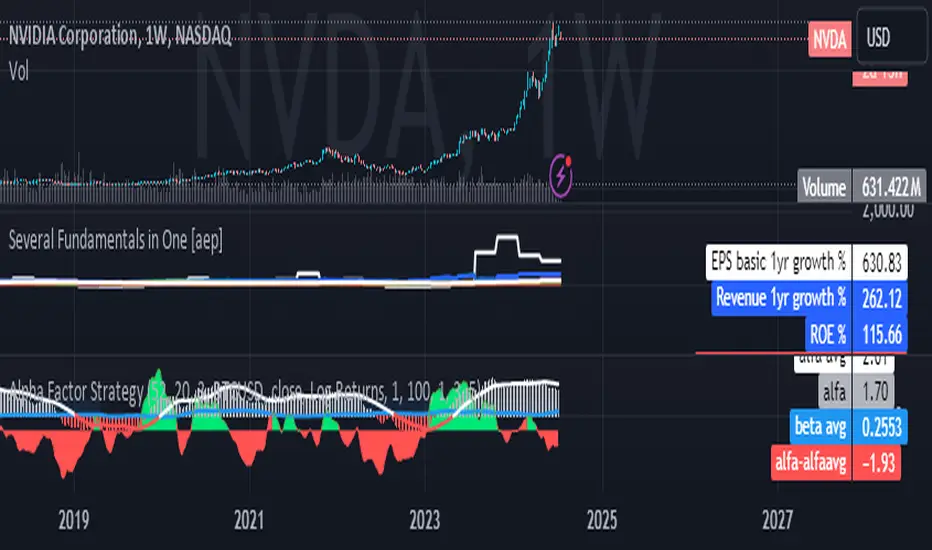
Several Fundamentals in One [aep]

**Financial Ratios Indicator**
This comprehensive Financial Ratios Indicator combines various essential metrics to help traders and investors evaluate the financial health of companies at a glance. The following categories are included:
### Valuation Ratios
- **P/B Ratio (Price to Book Ratio)**: Assesses if a stock is undervalued or overvalued by comparing its market price to its book value.
- **P/E Ratio TTM (Price to Earnings Ratio Trailing Twelve Months)**: Indicates how many years of earnings would be needed to pay the current stock price by comparing the stock price to earnings per share over the last twelve months.
- **P/FCF Ratio TTM (Price to Free Cash Flow Ratio Trailing Twelve Months)**: Evaluates a company's ability to generate free cash flow by comparing the market price to free cash flow per share over the last twelve months.
- **Tobin Q Ratio**: Indicates whether the market is overvaluing or undervaluing a company’s assets by comparing market value to replacement cost.
- **Piotroski F-Score (0-9)**: A scoring system that identifies financially strong companies based on fundamental metrics.
### Efficiency
- **Net Margin % TTM**: Measures profitability by calculating the percentage of revenue that becomes net profit after all expenses and taxes.
- **Free Cashflow Margin %**: Indicates a company’s efficiency in generating free cash flow from its revenues by showing the percentage of revenue that translates into free cash flow.
- **ROE%, ROIC%, ROA%**: Evaluate a company’s efficiency in generating profits from equity, invested capital, and total assets, respectively.
### Liquidity Metrics
- **Debt to Equity Ratio**: Shows the level of debt relative to equity, helping assess financial leverage.
- **Current Ratio**: Measures a company's ability to pay short-term debts by comparing current assets to current liabilities.
- **Long Term Debt to Assets**: Evaluates the level of long-term debt in relation to total assets.
### Dividend Policy
- **Retention Ratio % TTM**: Indicates the proportion of earnings reinvested in the company instead of distributed as dividends.
- **Dividend/Earnings Ratio % TTM**: Measures the percentage of earnings paid out as dividends to shareholders.
- **RORE % TTM (Return on Retained Earnings)**: Assesses how effectively a company utilizes retained earnings to generate additional profits.
- **Dividend Yield %**: Indicates the dividend yield of a stock by comparing annual dividends per share to the current stock price.
### Growth Ratios
- **EPS 1yr Growth %**: Measures the percentage growth of earnings per share over the last year.
- **Revenue 1yr Growth %**: Evaluates the percentage growth of revenue over the last year.
- **Sustainable Growth Rate**: Indicates the growth rate a company can maintain without increasing debt, assessing sustainable growth using internal resources.
Utilize this indicator to streamline your analysis of financial performance and make informed trading decisions.
Open-source script
In true TradingView spirit, the author of this script has published it open-source, so traders can understand and verify it. Cheers to the author! You may use it for free, but reuse of this code in publication is governed by House rules. You can favorite it to use it on a chart.
Disclaimer
The information and publications are not meant to be, and do not constitute, financial, investment, trading, or other types of advice or recommendations supplied or endorsed by TradingView. Read more in the Terms of Use.