OPEN-SOURCE SCRIPT
Treasury Yields Heatmap [By MUQWISHI]
Updated
▋ INTRODUCTION :
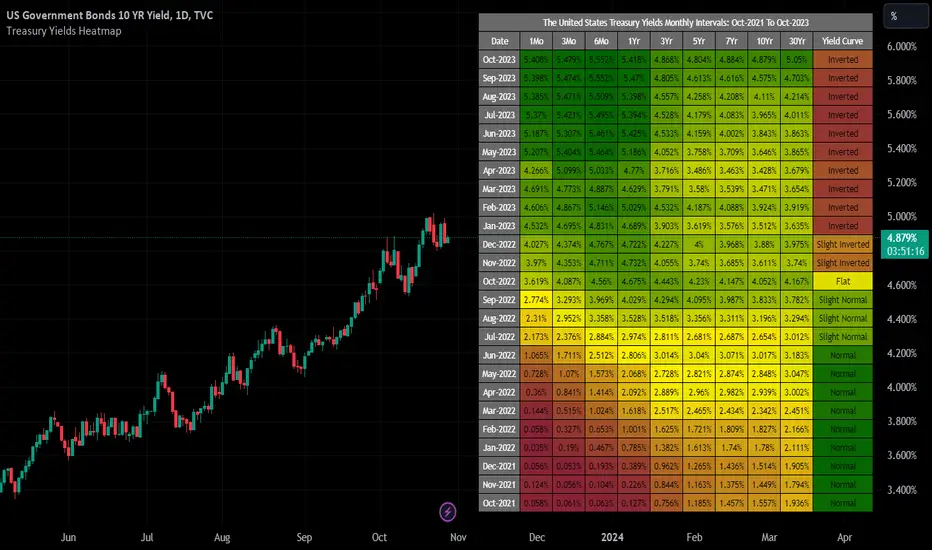
The “Treasury Yields Heatmap” generates a dynamic heat map table, showing treasury yield bond values corresponding with dates. In the last column, it presents the status of the yield curve, discerning whether it’s in a normal, flat, or inverted configuration, which determined by using Pearson's linear regression coefficient. This tool is built to offer traders essential insights for effectively tracking bond values and monitoring yield curve status, featuring the flexibility to input a starting period, timeframe, and select from a range of major countries' bond data.
_______________________
▋ OVERVIEW:

______________________
▋ YIELD CURVE:
It is determined through Pearson's linear regression coefficient and considered…
_______________________
▋ INDICATOR SETTINGS:
#Section One: Table Setting

#Section Two: Technical Setting

(1) Country: Select country’s treasury yields data
(2) Timeframe: Time interval.
(3) Fetch By:
(3A) Date: Retrieve data by beginning of date.
(3B) Period: Retrieve data by specifying the number of time series back.
Enjoy. Please let me know if you have any questions.
Thank you.
The “Treasury Yields Heatmap” generates a dynamic heat map table, showing treasury yield bond values corresponding with dates. In the last column, it presents the status of the yield curve, discerning whether it’s in a normal, flat, or inverted configuration, which determined by using Pearson's linear regression coefficient. This tool is built to offer traders essential insights for effectively tracking bond values and monitoring yield curve status, featuring the flexibility to input a starting period, timeframe, and select from a range of major countries' bond data.
_______________________
▋ OVERVIEW:
______________________
▋ YIELD CURVE:
It is determined through Pearson's linear regression coefficient and considered…
- R ≥ 0.7 → Normal
- 0.7 > R ≥ 0.35 → Slight Normal
- 0.35 > R > -0.35 → Flat
- -0.35 ≥ R > -0.7 → Slight Inverted
- -0.7 ≥ R → Inverted
_______________________
▋ INDICATOR SETTINGS:
#Section One: Table Setting
#Section Two: Technical Setting
(1) Country: Select country’s treasury yields data
(2) Timeframe: Time interval.
(3) Fetch By:
(3A) Date: Retrieve data by beginning of date.
(3B) Period: Retrieve data by specifying the number of time series back.
Enjoy. Please let me know if you have any questions.
Thank you.
Release Notes
Amended the number of decimal places.
Trusted Pine Programmer, I Provide Coding Services. For Inquiries
► Website muqwishi.com/home/quotation/
► Telegram t.me/MUQWISHI
⛾ Support My Work on “Buy Me a Coffee” buymeacoffee.com/muqwishi
Trusted Pine Programmer, I Provide Coding Services. For Inquiries
► Website muqwishi.com/home/quotation/
► Telegram t.me/MUQWISHI
⛾ Support My Work on “Buy Me a Coffee” buymeacoffee.com/muqwishi
Open-source script
In true TradingView spirit, the author of this script has published it open-source, so traders can understand and verify it. Cheers to the author! You may use it for free, but reuse of this code in publication is governed by House rules. You can favorite it to use it on a chart.
Disclaimer
The information and publications are not meant to be, and do not constitute, financial, investment, trading, or other types of advice or recommendations supplied or endorsed by TradingView. Read more in the Terms of Use.