PROTECTED SOURCE SCRIPT
VolatilityCone by ImpliedVolatility
Updated
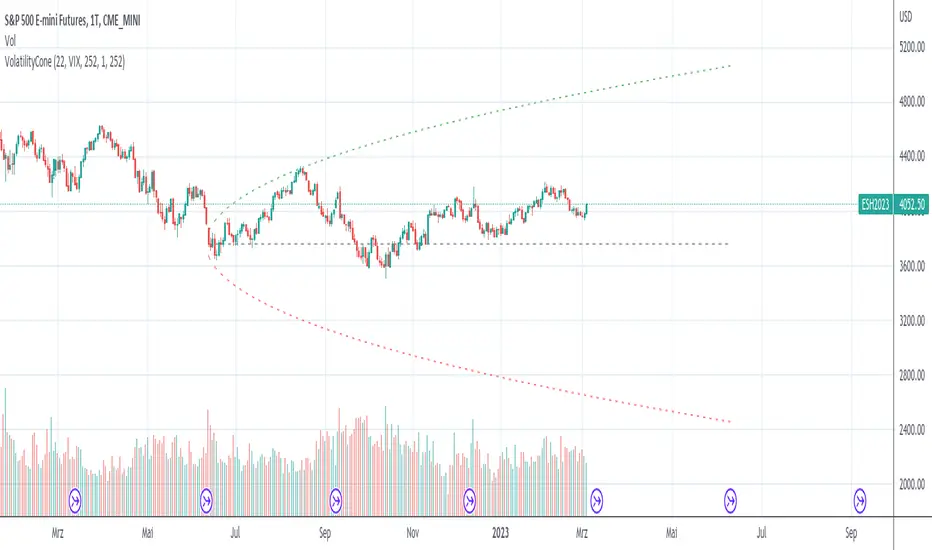
This volatility cone draws the implied volatility as standard deviations from a measurement date.
For best results set measurement date to high volume bars.
How to use:
1) Select VolatilityCone from Indicators
2) Click to the chart to set the measurement date
3) Determine the impliedvolatility for the measurement date of your symbol
e.g.
For S&P500 use VIX value at measurement date for implied volatility
Release Notes
This volatility cone draws the implied volatility as standard deviations from a measurement date.For best results set measurement date to high volume bars.
How to use:
1) Select VolatilityCone from Indicators
2) Click to the chart to set the measurement date
3) Determine the impliedvolatility for the measurement date of your symbol
e.g.
For S&P500 use VIX value at measurement date for implied volatility
Release Notes
RefactoringRelease Notes
refactoringRelease Notes
refactoringRelease Notes
Added the z-score of the latest close price to the status line. The z-score is the number of standard deviations from the mean value for a given price.Release Notes
refactoringRelease Notes
Added handling to request implied volatility by symbol. (e.g. VIX)Release Notes
refactoringRelease Notes
- added auto-positioning by highest volume - BETARelease Notes
addd auto configuration for number of cones - zero means autoRelease Notes
refactoringRelease Notes
fixed bugDisclaimer
The information and publications are not meant to be, and do not constitute, financial, investment, trading, or other types of advice or recommendations supplied or endorsed by TradingView. Read more in the Terms of Use.