PROTECTED SOURCE SCRIPT
Updated Trend-based EMA Ribbon
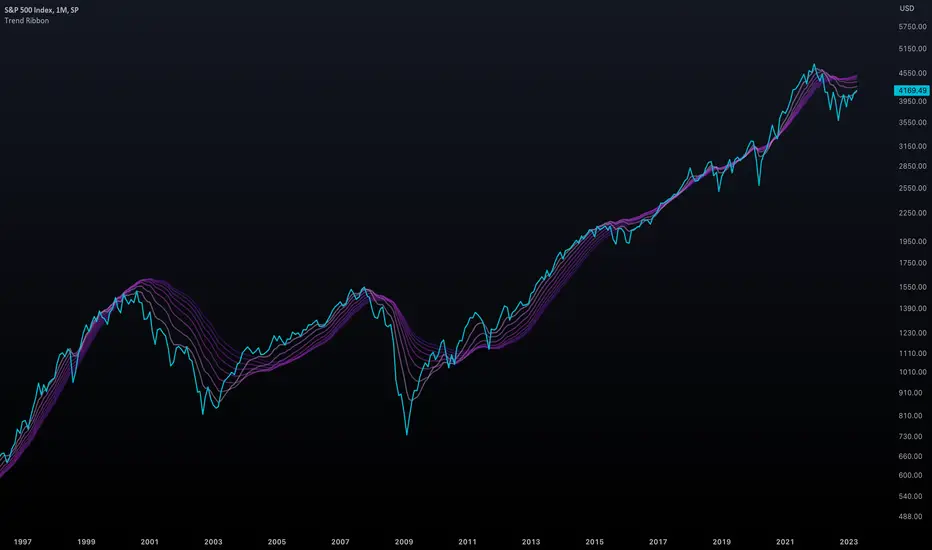
An innovative EMA Ribbon proves a mighty candidate to the standard EMA Ribbons we commonly use.
The standard EMA defines support/resistance levels based on the horizontal axis. With this indicator, the trend itself is taken into account. This EMA Ribbon is based around the trend. It provides a whole new way to understand/predict support/resistance levels.
It is a cousin to this indicator I built.

Tread lightly, for this is hallowed ground.
-Father Grigori
The standard EMA defines support/resistance levels based on the horizontal axis. With this indicator, the trend itself is taken into account. This EMA Ribbon is based around the trend. It provides a whole new way to understand/predict support/resistance levels.
It is a cousin to this indicator I built.
Tread lightly, for this is hallowed ground.
-Father Grigori
Release Notes
Changes in default values.Release Notes
Important code fixes.Release Notes
More changes in code.Release Notes
Added smoothing functionality.Release Notes
Previous versions didn't create a ribbon for the initial data. Now this is fixed.Release Notes
Added support to plot the baseline EMA.Release Notes
Added functionality to change between a SMA trend and an EMA one.When the (progressive) option is selected in the trend, the MA is progressively generated from the very first value.
Classic N-length MAs (not progressive) ignore the first N-1 bars and continue from the Nth one.
Do note that for now, you may only choose as input the main data source. There is some functionality that needs to be fixed for you to use this indicator on top of other indicators.
Release Notes
Upgrades in the "progressive" option.Release Notes
Added a background for a cleaner look. You can always activate the ordinary ribbon lines.The "Classic Ribbon Edge" serves as a point of reference as to where the classic ribbon would end.
Release Notes
More prettification updates.I know I constantly update my scrips, oh well... deal with it.
Release Notes
INCREDIBLE new update. Significant changes in the invisible code.Now it properly works with charts like the yield curve.
Curiously, a significant reversal pattern is printed.
Release Notes
Oops I broke it. See you around...Release Notes
Did some important debugging.Protected script
This script is published as closed-source. However, you can use it freely and without any limitations – learn more here.
Disclaimer
The information and publications are not meant to be, and do not constitute, financial, investment, trading, or other types of advice or recommendations supplied or endorsed by TradingView. Read more in the Terms of Use.
Protected script
This script is published as closed-source. However, you can use it freely and without any limitations – learn more here.
Disclaimer
The information and publications are not meant to be, and do not constitute, financial, investment, trading, or other types of advice or recommendations supplied or endorsed by TradingView. Read more in the Terms of Use.