OPEN-SOURCE SCRIPT
Opening Range Fibonaccis
Updated

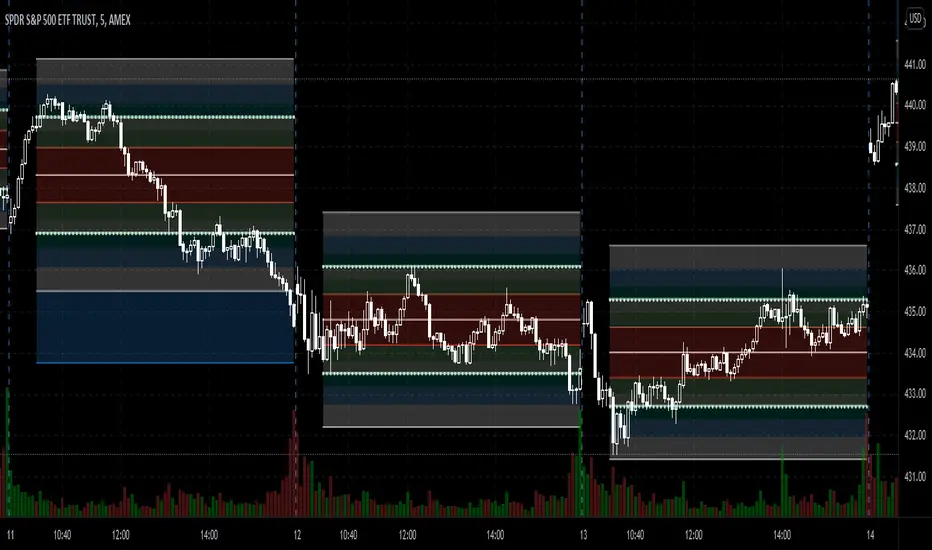
This indicator uses the concept of the "Opening Range" to create a Fibonacci zone from the high and low set during a specific time period after open (Defaults to 9:30 - 10:05 AM, EST)
The Opening Range is a popular tool for intraday technical analysis. Price frequently uses these levels as support/resistance, and a breakout from within the range can be a sign of further movement.
The Fibonacci levels are set such that the opening range high/low fall on the +/-0.5 fib. This creates an "extended range" outside of the opening range that may be useful during breakouts.
Release Notes
- Reordered plot drawing and increased the default size of the opening range high/low circles to improve readability.
Release Notes
- Added a "Fibonacci Scale" input option to improve customization. Default value of 1.0 matches the current settings.
Release Notes
- Added an optional "Afternoon Range" option. When on, this sets a new range based on the high/low set during the period of 1:30pm to 2:05pm EST (or custom time period).
Release Notes
- Added a "Plot For Today Only" toggle that hides ranges on previous days on intraday charts.
Release Notes
- Added a timezone selection to input options to make customizing for different markets easier.
Release Notes
- Added a toggle to display price labels for each Fibonacci level - "Show Price Labels" at the bottom of the input settings.
Release Notes
- Updated the default time periods for calculating ranges.
Release Notes
- Fixed problem where price labels wouldn't advance with new bars.
Release Notes
- Added the option to base the opening range plots on 1 minute candles regardless of chart resolution. Useful for short periods, such as the opening minute.
- Fixed bug where toggling fib levels off still showed the fill.
Release Notes
- Fixed bug with Zone Fill setting not working properly.
- Added 'Show Fib Value Labels" option. This and Show Price Labels can be used independently or together.
Open-source script
In true TradingView spirit, the author of this script has published it open-source, so traders can understand and verify it. Cheers to the author! You may use it for free, but reuse of this code in publication is governed by House rules. You can favorite it to use it on a chart.
Thanks for using my indicators; I hope they make you money! Check out the website link for more, and thanks for your support!
Disclaimer
The information and publications are not meant to be, and do not constitute, financial, investment, trading, or other types of advice or recommendations supplied or endorsed by TradingView. Read more in the Terms of Use.