PROTECTED SOURCE SCRIPT
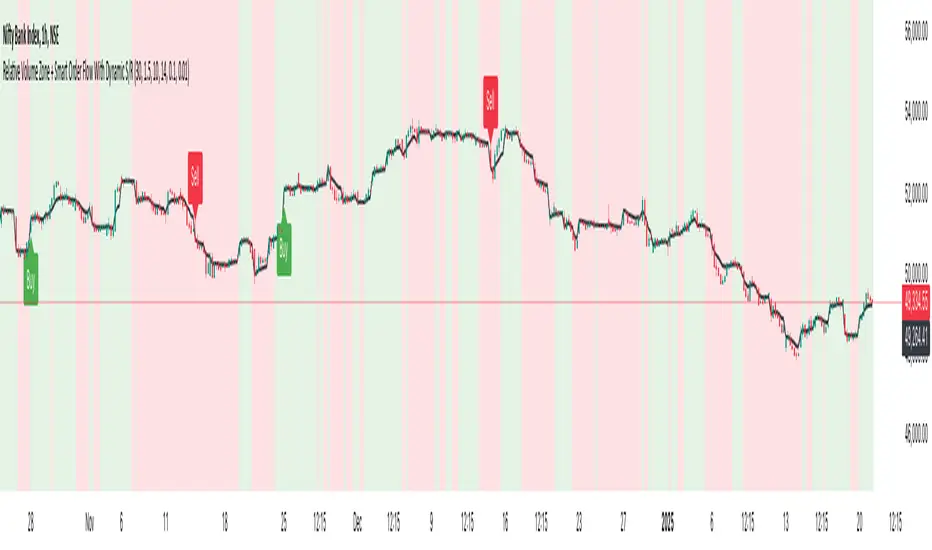
Relative volume zone + Smart Order Flow Dynamic S/R
Updated
Overview:
The Relative Volume Zone + Smart Order Flow with Dynamic S/R indicator is designed to help traders identify key trading opportunities by combining multiple technical components. This script integrates relative volume analysis, order flow detection, VWAP, RSI filtering, and dynamic support and resistance levels to offer a comprehensive view of the market conditions. It is particularly effective on shorter timeframes (M5, M15), making it suitable for scalping and day trading strategies.
Key Components:
1. Relative Volume Zones:
• The script calculates the relative volume by comparing the current volume with the average volume over a defined lookback period (volLookback). When the relative volume exceeds a specified multiplier (volMultiplier), it indicates a high volume zone, signaling potential accumulation or distribution areas.
• Purpose: Identifies high-volume trading zones that may act as significant support or resistance, indicating possible entry or exit points.
2. Smart Order Flow Analysis:
• The indicator uses Volume Delta (the difference between buying and selling volume) and a Cumulative Delta to detect order imbalances in the market.
• Order Imbalance is identified using a moving average of the Volume Delta (orderImbalance), which helps highlight hidden buying or selling pressure.
• Purpose: Reveals market sentiment by showing whether buyers or sellers dominate the market, aiding in the identification of trend reversals or continuations.
3. VWAP (Volume Weighted Average Price):
• VWAP is calculated over a default daily length (vwapLength) to show the average price a security has traded at throughout the day, based on both volume and price.
• Purpose: Provides insight into the fair value of the asset, indicating whether the market is in an accumulation or distribution phase.
4. RSI (Relative Strength Index) Filter:
• RSI is used to filter buy and sell signals, preventing trades in overbought or oversold conditions. It is calculated using a specified period (rsiPeriod).
• Purpose: Reduces false signals and improves trade accuracy by only allowing trades when RSI conditions align with volume and order flow signals.
5. Dynamic Support and Resistance Levels:
• The script dynamically plots support and resistance levels based on recent swing highs and lows (swingLookback).
• Purpose: Identifies potential reversal zones where price action may change direction, allowing for more precise entry and exit points.
How It Works:
• Buy Signal:
A buy signal is generated when:
• The price enters a high-volume zone.
• The price crosses above a 5-period moving average.
• The cumulative delta shows more buying pressure (cumulativeDelta > SMA of cumulativeDelta).
• The RSI is below 70 (not in overbought conditions).
• Sell Signal:
A sell signal is generated when:
• The price enters a high-volume zone.
• The price crosses below a 5-period moving average.
• The cumulative delta shows more selling pressure (cumulativeDelta < SMA of cumulativeDelta).
• The RSI is above 30 (not in oversold conditions).
• Dynamic Support and Resistance Lines:
Drawn based on recent swing highs and lows, these lines provide context for potential price reversals or breakouts.
• VWAP and Order Imbalance Lines:
Plotted to show the average traded price and highlight order flow shifts, helping to validate buy/sell signals.
How to Use:
1. Apply the Indicator:
Add the script to your chart and adjust the settings to match your trading style and preferred timeframe (optimized for M5/M15).
2. Interpret the Signals:
Use the buy and sell signals in conjunction with dynamic support/resistance, VWAP, and order imbalance lines to identify high-probability trade setups.
3. Monitor Alerts:
Set alerts for significant order flow events to receive notifications when there is a positive or negative order imbalance, indicating potential market shifts.
What Makes It Unique:
This script is unique because it combines multiple market analysis tools — relative volume zones, smart order flow, VWAP, RSI filtering, and dynamic support/resistance — to provide a well-rounded, multi-dimensional view of the market. This integration allows traders to make more informed decisions by validating signals across various indicators, enhancing overall trading accuracy and effectiveness.
Release Notes
updated some conditions for buy/sellThe Relative Volume Zone + Smart Order Flow Dynamic S/R indicator combines several powerful technical analysis tools—relative volume, order flow delta, RSI, and VWAP—along with dynamic support and resistance levels to help traders capture high-probability buy and sell opportunities. This combination ensures that the indicator adapts to changing market conditions and provides signals based on a well-rounded analysis of both volume and price action.
Key Components:
1. Relative Volume Zones:
The script calculates relative volume by comparing the current volume to its moving average over a specified lookback period. This helps identify high-volume areas where significant buying or selling pressure may exist. These zones are crucial for confirming market sentiment and validating trend strength.
2. Order Flow Delta & Cumulative Delta:
The order flow delta measures the difference between up and down volume, giving insight into whether buyers or sellers are in control. The cumulative delta aggregates these values over time, helping to identify sustained buying or selling pressure. This adds another layer of confirmation when combined with volume-based signals.
3. Dynamic Support & Resistance:
Support and resistance levels are calculated dynamically based on the highest highs and lowest lows over a specified swing lookback period. This ensures that traders are always aware of key price levels where potential reversals or breakouts may occur.
4. VWAP (Volume Weighted Average Price):
VWAP is calculated to provide an intraday average price, giving insight into whether the current price is above or below the average price traded. This helps confirm market positioning and trend direction, especially when combined with the other signals.
5. RSI for Signal Filtering:
The RSI is used to filter buy and sell signals, ensuring that overbought or oversold conditions are accounted for, thus improving the accuracy of trend-following signals.
How the Components Work Together:
• Buy Signals: The indicator generates buy signals when relative volume exceeds a threshold, the cumulative delta is positive, and the price crosses above a moving average. Additionally, if the price touches an order imbalance line and closes above the VWAP, a reversal buy signal is triggered. These conditions help traders identify strong uptrends or reversal points with high volume support.
• Sell Signals: Sell signals are generated under similar conditions but in the opposite direction. The script identifies when relative volume is high, the cumulative delta turns negative, and the price crosses below a moving average, signaling a potential downtrend or reversal.
• Order Imbalance Detection: Order imbalances are highlighted visually, helping traders spot areas where buyers or sellers may be significantly out of balance. This feature allows traders to understand market microstructure and spot potential reversals.
Originality:
What makes this script unique is the combination of Relative Volume and Order Flow Delta, which provide a deep insight into market strength and momentum, alongside RSI and VWAP for trend filtering. By incorporating dynamic support and resistance levels based on recent price swings, the indicator dynamically adapts to different market conditions, making it useful for various timeframes and trading strategies.
How to Use:
• Adjust the input parameters (such as the volume lookback period, VWAP length, and delta period) based on your preferred trading timeframe.
• Look for buy signals when the conditions of relative volume, order flow delta, and VWAP alignment are met. Similarly, use sell signals to identify downtrends.
• Pay attention to the order imbalance zones highlighted by background colors and signals to gauge when the market is at a potential turning point.
This indicator is designed to provide comprehensive market insights in one tool, reducing the need for multiple indicators and streamlining decision-making.
Disclaimer
The information and publications are not meant to be, and do not constitute, financial, investment, trading, or other types of advice or recommendations supplied or endorsed by TradingView. Read more in the Terms of Use.