OPEN-SOURCE SCRIPT
VWMA + SMA BBollinger + RSI Strategy (ChartArt) mod by BiO618
Updated
This is a script I remade from the original ChartArt's "CA_RSI_Bolling_Strat".
I added a VWMA following the SMA basis curve.
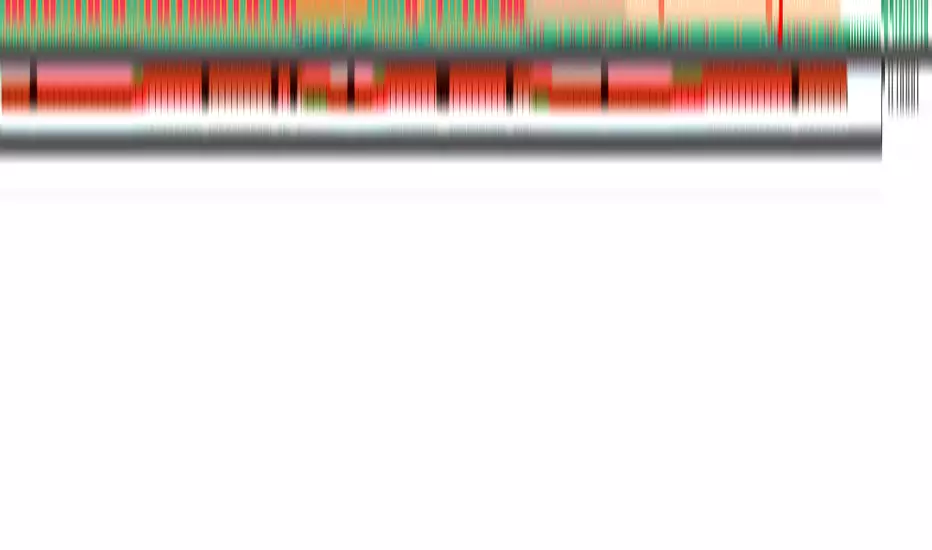
BBand was made with the SMA curve, +2DS.
The point of adding VWMA to the script is to get a fast correlation between price change and volume change.
How to interpret it:
Since 3-Intervals-VWMA = (P1*V1 + P2*V2 + P3*V3) / (V1+V2+V3)
As the volume grows, VWMA get smaller.
If the price goes to the upper band, and the VWMA follows it, Price grew more than Volume, and a correction would happen soon.
If the price goes to the lower band, and the VWMA follows it, Price dipped with a lot of Volume, and a continuation of trend would be expected.
If the price goes to the upper band, and the VWMA stays close to SMA, Price grew with a correspondient Volume, and the continuation of trend would be expected.
If the price goes to the lower band, and the VWMA stays close to SMA, Price dipped with low Volume, a correction would happen soon.
Remember that NO INDICATOR is flawless, support your interpretation with other indicators like RSI and MACD.
Hope you enjoy it!
φ!
I added a VWMA following the SMA basis curve.
BBand was made with the SMA curve, +2DS.
The point of adding VWMA to the script is to get a fast correlation between price change and volume change.
How to interpret it:
Since 3-Intervals-VWMA = (P1*V1 + P2*V2 + P3*V3) / (V1+V2+V3)
As the volume grows, VWMA get smaller.
If the price goes to the upper band, and the VWMA follows it, Price grew more than Volume, and a correction would happen soon.
If the price goes to the lower band, and the VWMA follows it, Price dipped with a lot of Volume, and a continuation of trend would be expected.
If the price goes to the upper band, and the VWMA stays close to SMA, Price grew with a correspondient Volume, and the continuation of trend would be expected.
If the price goes to the lower band, and the VWMA stays close to SMA, Price dipped with low Volume, a correction would happen soon.
Remember that NO INDICATOR is flawless, support your interpretation with other indicators like RSI and MACD.
Hope you enjoy it!
φ!
Release Notes
Some minor changes to cleanse it.Also:
Aqua = VWMA
Orange = SMA
Open-source script
In true TradingView spirit, the author of this script has published it open-source, so traders can understand and verify it. Cheers to the author! You may use it for free, but reuse of this code in publication is governed by House rules. You can favorite it to use it on a chart.
Disclaimer
The information and publications are not meant to be, and do not constitute, financial, investment, trading, or other types of advice or recommendations supplied or endorsed by TradingView. Read more in the Terms of Use.