OPEN-SOURCE SCRIPT
EPS & revenue
Updated

This Table shows Quarterly Earning per share & Quarterly revenue of any stock .
Release Notes
Updated Relative volume w.r.t. 50 days average and 50 days turnover, best works on daily time frame. Release Notes
Relative Volume 50 added with the title using the setting button Relative volume length could be selected and % with respect to Relative volume is shown with the title name.
Feel free to use this script.
comments and suggestions are appreciated.
Release Notes
Relative volume chart line removed. Release Notes
minor changes Release Notes
Relative volume color changed to green. Release Notes
turnover 50 days (in Cr.) changed to daily. Release Notes
Improved than before , Best worked in Daily time frame.
Added R vol
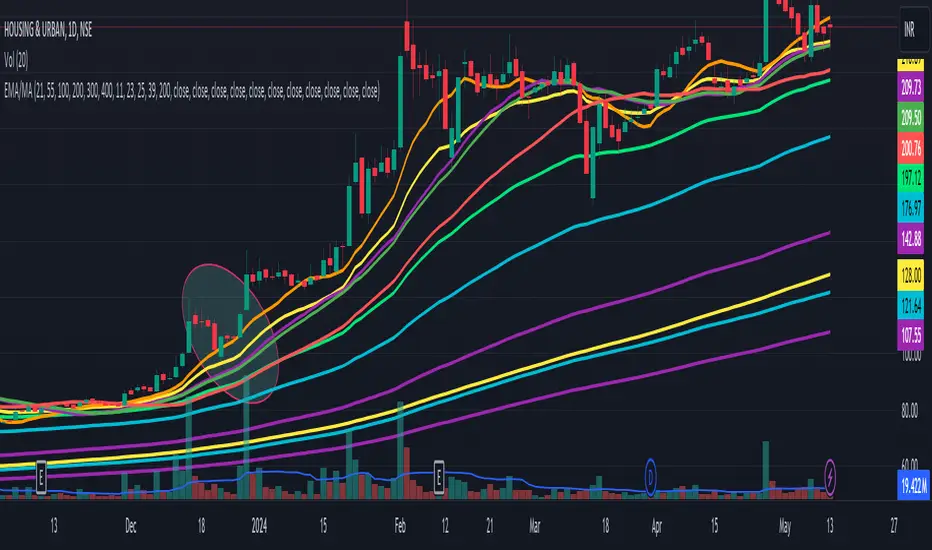
Added Tripe Moving average added with forcasting.
Added 52 week high low
down from 52 Week high
Up from 52 week low
Inside candle highlighted in chart .
by using this script it will save your time analysis time .
Special thanks thanks to VCPSwing for suggesting improvement.
Feel free to use this script.
Feedback and suggestions are welcomed.
Release Notes
Did some minor improvement Release Notes
Fixed error Release Notes
inside candle highlighted with blue dot. border added .
some visual changes made.
Release Notes
....Release Notes
some minor improvements. Release Notes
Text color improved (changed to Black)Release Notes
EPS error solved. Release Notes
Operating Profit Margin data added. Release Notes
3 moving average added in script can be customized using setting option , color , linewidth, show/hide can be done. Release Notes
updated color conditions. Release Notes
updated .Open-source script
In true TradingView spirit, the author of this script has published it open-source, so traders can understand and verify it. Cheers to the author! You may use it for free, but reuse of this code in publication is governed by House rules. You can favorite it to use it on a chart.
Disclaimer
The information and publications are not meant to be, and do not constitute, financial, investment, trading, or other types of advice or recommendations supplied or endorsed by TradingView. Read more in the Terms of Use.