PROTECTED SOURCE SCRIPT
Comprehensive Technical Analysis

Comprehensive Technical Analysis Script
Overview
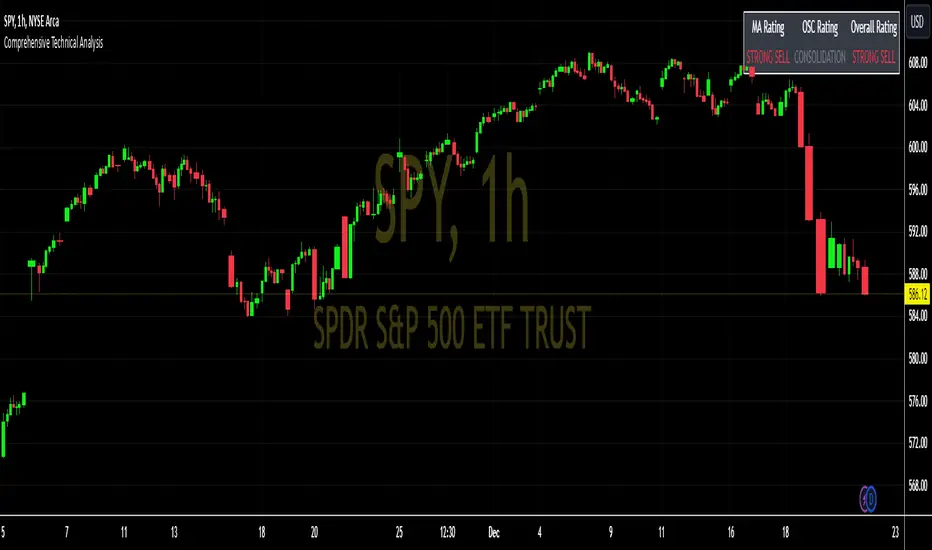
This Script for TradingView is designed to perform and display a detailed technical analysis using a range of moving averages and oscillators. The script provides a summary of market conditions based on various indicators to help traders make informed decisions.
Key Features - Technical Indicators:
Moving Averages:
Oscillators:
Point System - Indicator Points:
Bullish Signal: Each indicator contributing to a positive market sentiment adds points.
Bearish Signal: Each indicator contributing to a negative market sentiment subtracts points.
Point Calculation:
Moving Averages: Points are assigned based on whether the current price is above or below each moving average.
Oscillators: Points are assigned based on whether the oscillator values are in bullish or bearish zones.
Summary Text:
Categorization: Based on the total points calculated from all indicators, the market condition is categorized into:
Text Display: The summary text reflects the overall market sentiment and is color-coded for easy interpretation.
Table Display - The Position of the table can be customized by the user:
Vertical: Options include Top, Center, Bottom
Horizontal: Options include Left, Center, Right
Table Content:
Summary Text and Points: Displays the summary of technical indicators along with the calculated points.
Overview
This Script for TradingView is designed to perform and display a detailed technical analysis using a range of moving averages and oscillators. The script provides a summary of market conditions based on various indicators to help traders make informed decisions.
Key Features - Technical Indicators:
Moving Averages:
- Simple Moving Average (SMA): Calculates the average price over a specified period.
- Exponential Moving Average (EMA): Reacts faster to recent price changes by giving more weight to recent prices.
- Weighted Moving Average (WMA): Weighs prices based on their position, giving more importance to recent prices.
- Hull Moving Average (HMA): Reduces lag and provides a smoother trend line.
- Triple Exponential Moving Average (TEMA): Combines three EMAs to minimize lag and offer a responsive trend indicator.
- Exponential Moving Average of an Exponential Moving Average (EMAX): Applies an EMA twice to smooth out trends further.
- Triangular Moving Average (TMA): Provides a smoother moving average by averaging over a triangular window.
Oscillators:
- Relative Strength Index (RSI): Measures the speed and change of price movements to identify overbought or oversold conditions.
- Stochastic Oscillator (%K): Compares a security’s closing price to its price range over a specific period to spot potential reversal points.
- Commodity Channel Index (CCI): Identifies cyclical trends and measures the deviation of the price from its average.
- Moving Average Convergence Divergence (MACD): Shows the relationship between two EMAs to identify changes in trend strength, direction, momentum, and duration.
- Awesome Oscillator (AO): Measures market momentum by comparing two different moving averages.
- Average Directional Index (ADX): Determines the strength of a trend and whether the market is trending or ranging.
- Williams %R (WPR): Identifies overbought and oversold levels with a different calculation approach compared to the RSI.
Point System - Indicator Points:
Bullish Signal: Each indicator contributing to a positive market sentiment adds points.
Bearish Signal: Each indicator contributing to a negative market sentiment subtracts points.
Point Calculation:
Moving Averages: Points are assigned based on whether the current price is above or below each moving average.
Oscillators: Points are assigned based on whether the oscillator values are in bullish or bearish zones.
Summary Text:
Categorization: Based on the total points calculated from all indicators, the market condition is categorized into:
- Strong Bullish: More than 8 points
- Bullish: Between 3 and 8 points
- Neutral: Between -2 and 2 points
- Bearish: Between -3 and -8 points
- Strong Bearish: Less than -8 points
Text Display: The summary text reflects the overall market sentiment and is color-coded for easy interpretation.
Table Display - The Position of the table can be customized by the user:
Vertical: Options include Top, Center, Bottom
Horizontal: Options include Left, Center, Right
Table Content:
Summary Text and Points: Displays the summary of technical indicators along with the calculated points.
Disclaimer
The information and publications are not meant to be, and do not constitute, financial, investment, trading, or other types of advice or recommendations supplied or endorsed by TradingView. Read more in the Terms of Use.