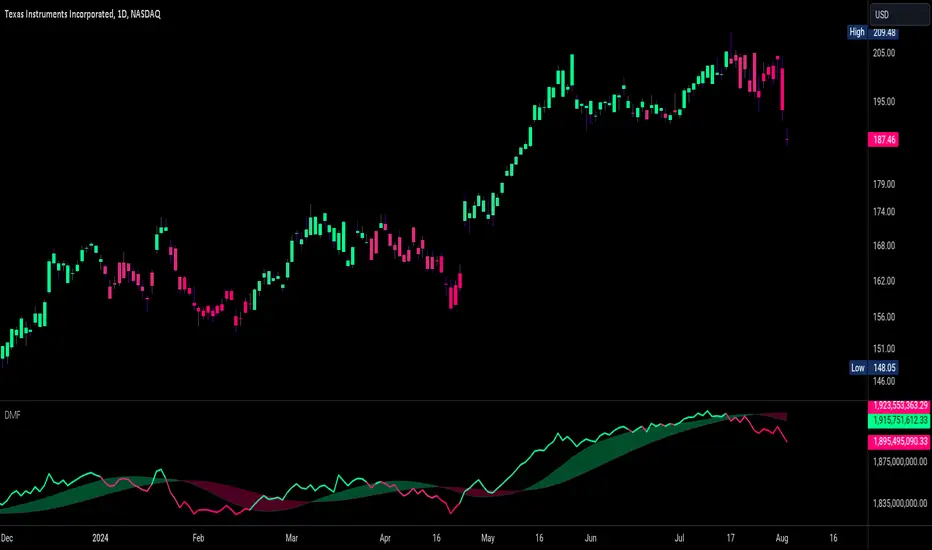
Dynamic Money Flow is a volume indicator based on Marc Chaikin's Money Flow with a few improvements.
It can be used to confirm break-outs and trends.
Zero line crosses and divergences can provide useful signals while considering chart analysis as well.
Two weaknesses of CMF have been already fixed by Colin Twiggs (IncredibleCharts)...
1.CMF uses Chaikin's accumulation/distribution line to calculate the flow of money.
Accumulation/distribution line does not take the gaps into account. This can be solved using true range.
I call it true accumulation/distribution.
2.Oscillators have a tendency to center because of averaging calculations.
DMF is average of flowing volume divided by average of total volume. This means indicator plots the change of first factor compared to the other one. In Simple Averaging method every data is given an equal weight thus when the last data drops it will have heavy impact on the averages and the change of them.
It is much easier to identity these impacts after the drop of very high or very low data... So reducing the weight exponentially is a better option.

3.There is something else with CMF... changes of close price is ignored, because the formula only compares close price to its range.
To include the movements of close beside the close to range comparison, the distance between two last close prices should be compared to true range as well.
So volume can be distributed between close to range comparison (True Accumulation/Distribution) and close to close comparison automatically. And then results are summed to have a single multiplier.
An example for how close to close comparison affects DMF...

Or here you can see how lower wicks keep TMF (same as CMF in this case) from crossing zero line while price is trending down.

It can be used to confirm break-outs and trends.
Zero line crosses and divergences can provide useful signals while considering chart analysis as well.
Two weaknesses of CMF have been already fixed by Colin Twiggs (IncredibleCharts)...
1.CMF uses Chaikin's accumulation/distribution line to calculate the flow of money.
Accumulation/distribution line does not take the gaps into account. This can be solved using true range.
I call it true accumulation/distribution.
2.Oscillators have a tendency to center because of averaging calculations.
DMF is average of flowing volume divided by average of total volume. This means indicator plots the change of first factor compared to the other one. In Simple Averaging method every data is given an equal weight thus when the last data drops it will have heavy impact on the averages and the change of them.
It is much easier to identity these impacts after the drop of very high or very low data... So reducing the weight exponentially is a better option.
3.There is something else with CMF... changes of close price is ignored, because the formula only compares close price to its range.
To include the movements of close beside the close to range comparison, the distance between two last close prices should be compared to true range as well.
So volume can be distributed between close to range comparison (True Accumulation/Distribution) and close to close comparison automatically. And then results are summed to have a single multiplier.
An example for how close to close comparison affects DMF...
Or here you can see how lower wicks keep TMF (same as CMF in this case) from crossing zero line while price is trending down.
Release Notes
1. Added an optional moving average: The main purpose is to receive a smoother form of oscillator while also having the original line.It can reduce excessive false center crosses on volatile market situations, and it will help traders to develop new strategies.
User can choose between simple and exponential moving averages.
2. Volume simulation: If this option is enabled, indicator will use formation of candles to simulate an alternative volume. It is very helpful when volume is not provided for a security or the volume is not proper (for example it can be very low which can prevent indicator from adopting to price movements). Otherwise it is suggested to disable this option.
Release Notes
Default Period input changed to 26.Simple moving average type replaced with WMA.
Added another moving average.
Moving averages can be turned off by setting their length to zero:0.
Some visual changes.
Release Notes
New indicator mode - Cumulative: I just kept up with my old fashion of making scripts a bit complicated instead of going for a new one. However, thanks to TradingView I could put the other new stuff into a different section.This mode represents the cumulative form of DMF.
Note that Line changes color on slow MA cross on this mode. I will try to work more on theming next time.
Experimental options: this section includes options that are better to be left unchanged unless there is no better choice or unless the changes are tested.
Release Notes
- Added bar color- Two new moving averages
The Tilson Moving Average (T3)
John Ehler's Fractal Adaptive Moving Average (FRAMA)
Open-source script
In true TradingView spirit, the creator of this script has made it open-source, so that traders can review and verify its functionality. Kudos to the author! While you can use it for free, remember that republishing the code is subject to our House Rules.
Disclaimer
The information and publications are not meant to be, and do not constitute, financial, investment, trading, or other types of advice or recommendations supplied or endorsed by TradingView. Read more in the Terms of Use.
