OPEN-SOURCE SCRIPT
True stock performance based on EY Bar divergence

I created this indicator to be used in conjunction with my other indicator "True stock performance based on Earnings Yield". I've detailed in that description how true performance is calculated. In short it measures how much EY is moving in relation to the stock price. The theory is that if stock price is moving heavily while EY isn't you have a sentiment driven trend and the stock isn't traded on fundamentals.
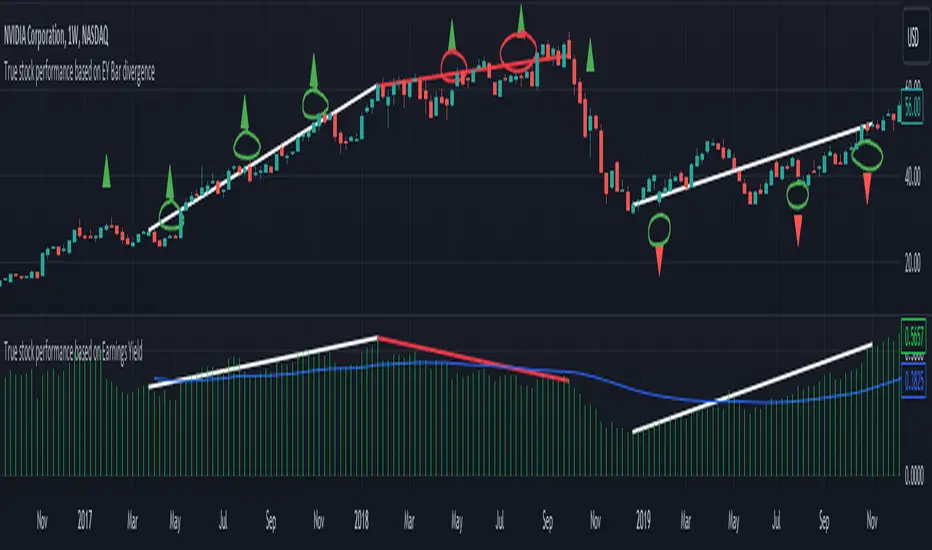
This indicators marks bars when stock performance divergences from true performance.
Green upward triangle = The true performance closes lower than previous while stock price is closing higher. This indicates a optimistic sentiment as stock price is pushed up even though price based on EY is moving down.
Red downward triangle = The true performance closes higher than previous while stock price closing lower. This indicates a negative sentiment as stock price is pushed down even though price based on EY is moving up.
How do I use it?
I use it to confirm when sentiment has taken taken over a stock. If you have a fair uptrend (when both stock performance and true performance are doing higher highs), optimistic divergencies are welcome. I've used NVIDIA from 2017 to 2019 to demonstrate.

But if true performance starts to make lower highs while stock performance keeps going up and you see optimistic divergencies, you can tell that the market is getting overoptimistic.

When the stock had crashed it eventually bottomed and started to make higher lows together with an uptrend of true performance, which I count as a fair uptrend. Regardless of that you start to see some negative divergencies indicating that people are scared that the stock will drop again and oversell. These opportunities can be good places to buy more.

But i don't care about earnings, I'm a technical trader. Do i have any use for it?
You possibly could, yes. If you want to follow the crowd, optimistic divergencies confirms that the market is still interested in the stock and may keep pushing the price up. But be careful. Negative divergencies almost never marks any tops, it often confirms downtrends and may indicate bottoms. Often the optimistic divergencies marks the top so don't buy more blindly using this indicator.
This indicators marks bars when stock performance divergences from true performance.
Green upward triangle = The true performance closes lower than previous while stock price is closing higher. This indicates a optimistic sentiment as stock price is pushed up even though price based on EY is moving down.
Red downward triangle = The true performance closes higher than previous while stock price closing lower. This indicates a negative sentiment as stock price is pushed down even though price based on EY is moving up.
How do I use it?
I use it to confirm when sentiment has taken taken over a stock. If you have a fair uptrend (when both stock performance and true performance are doing higher highs), optimistic divergencies are welcome. I've used NVIDIA from 2017 to 2019 to demonstrate.
But if true performance starts to make lower highs while stock performance keeps going up and you see optimistic divergencies, you can tell that the market is getting overoptimistic.
When the stock had crashed it eventually bottomed and started to make higher lows together with an uptrend of true performance, which I count as a fair uptrend. Regardless of that you start to see some negative divergencies indicating that people are scared that the stock will drop again and oversell. These opportunities can be good places to buy more.
But i don't care about earnings, I'm a technical trader. Do i have any use for it?
You possibly could, yes. If you want to follow the crowd, optimistic divergencies confirms that the market is still interested in the stock and may keep pushing the price up. But be careful. Negative divergencies almost never marks any tops, it often confirms downtrends and may indicate bottoms. Often the optimistic divergencies marks the top so don't buy more blindly using this indicator.
Open-source script
In true TradingView spirit, the author of this script has published it open-source, so traders can understand and verify it. Cheers to the author! You may use it for free, but reuse of this code in publication is governed by House rules. You can favorite it to use it on a chart.
Disclaimer
The information and publications are not meant to be, and do not constitute, financial, investment, trading, or other types of advice or recommendations supplied or endorsed by TradingView. Read more in the Terms of Use.