PROTECTED SOURCE SCRIPT
Fundur - Easy Zones

Fundur Easy Zones Trading Indicator
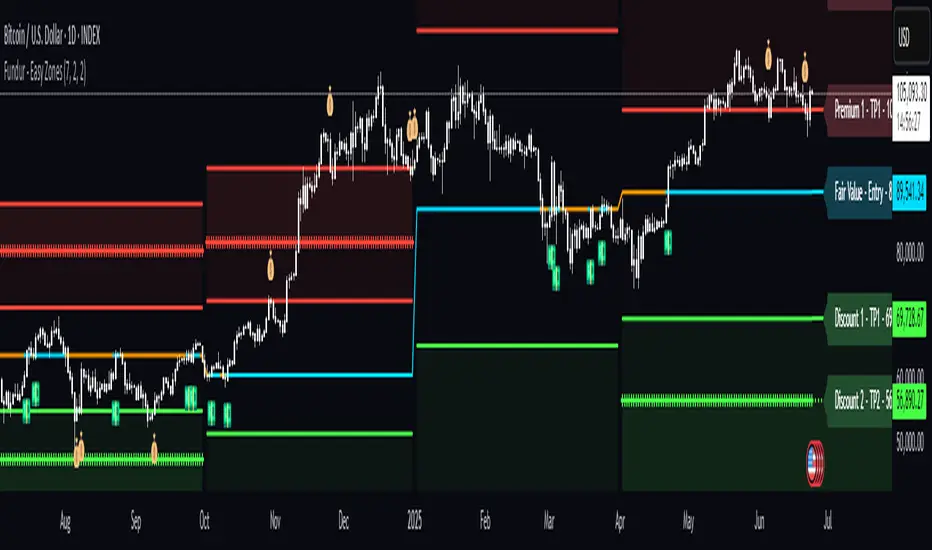
The Fundur Easy Zones trading indicator is designed to simplify market analysis by visually marking critical trading zones. This tool helps traders identify optimal buy and sell areas based on historical price action, making it easier to make informed trading decisions.
Calculation Methodology
The Easy Zones indicator employs pivot point calculations combined with price action analysis and the Average True Range (ATR) to determine key trading zones. These zones are calculated by analyzing market volatility and price movements within each timeframe, allowing the identification of significant discount and premium levels.
Features Overview
Zones Settings:
Structure Settings:
DP (Discount and Premium) Settings:
Highlight Buy and Sell Zones:
Label Settings:
Symbols Settings:
How to Use the Easy Zones Indicator
Identifying Entry Points:
Identifying Exit Points:
Using Fair Value:
Strategic Planning:
Best Practices
Historical Analysis:
Customization:
Risk Management:
By integrating the Fundur Easy Zones indicator into your trading strategy, you can enhance your market analysis, make more informed decisions, and ultimately improve your trading performance.
The Fundur Easy Zones trading indicator is designed to simplify market analysis by visually marking critical trading zones. This tool helps traders identify optimal buy and sell areas based on historical price action, making it easier to make informed trading decisions.
Calculation Methodology
The Easy Zones indicator employs pivot point calculations combined with price action analysis and the Average True Range (ATR) to determine key trading zones. These zones are calculated by analyzing market volatility and price movements within each timeframe, allowing the identification of significant discount and premium levels.
- Pivot Points: The indicator calculates pivot points based on the average of high, low, and close prices from previous periods. These pivot points serve as the foundational levels from which discount and premium zones are derived.
- Price Action Analysis: Historical price data is scrutinized to identify patterns and behaviors that signify potential reversal points. This analysis helps in pinpointing zones where the market is likely to experience significant support (discount) or resistance (premium).
- Average True Range (ATR): ATR is used to measure market volatility. By incorporating ATR into the calculations, the indicator adjusts the zone boundaries to reflect current market conditions, ensuring that the zones remain relevant and accurate. Higher ATR values indicate greater volatility and wider zones, while lower ATR values result in narrower zones.
- Discount and Premium Levels: Based on the pivot points and ATR, the indicator calculates various tiers of discount and premium levels. These tiers (D1, D2, D3 for discounts and P1, P2, P3 for premiums) represent increasing levels of price deviation from the mean, providing traders with clear entry and exit points.
Features Overview
Zones Settings:
- Zones History Length: Adjust the number of historical zones displayed on the chart to analyze past price behavior.
- Levels Line Width: Customize the thickness of the zone lines for better visibility.
Structure Settings:
- Show Fair Value: Display the fair value zone, providing a visual reference for equilibrium price levels. The fair value is calculated based on the median price over the selected period.
DP (Discount and Premium) Settings:
- Enable Discount and Premium Levels: Activate the display of critical buy (discount) and sell (premium) zones. These zones are determined using price deviation analysis from the mean, identifying significant discount (support) and premium (resistance) levels.
- Tiered Levels: Visualize up to three levels of discount and premium zones, each with specific target prices (TP1, TP2, TP3), representing different levels of price deviation significance.
Highlight Buy and Sell Zones:
- Enable Background: Highlight the background of buy and sell zones for enhanced clarity.
Label Settings:
- Enable All Labels: Ensure all labels are visible for quick reference.
- Show Descriptive Title: Display titles for each zone, making it easier to understand the context.
- Show Take Profit Targets (TP): Clearly mark take profit targets within each zone.
- Show Price: Display price levels for each zone for precise entry and exit points.
Symbols Settings:
- Fair Value, Premium, and Discount Indicators: Customize symbols to represent gaining or losing fair value, premium, and discount levels, enhancing visual cues for market sentiment.
How to Use the Easy Zones Indicator
Identifying Entry Points:
- Use the Discount Zones to identify optimal buy areas. The levels (D1, D2, D3) represent increasing levels of discount, with D1 being the least discounted and D3 the most.
- Place buy orders at or near these zones to take advantage of potential price reversals.
Identifying Exit Points:
- Use the Premium Zones to identify optimal sell areas. The levels (P1, P2, P3) represent increasing levels of premium, with P1 being the least and P3 the highest.
- Place sell orders at or near these zones to maximize profits on upward price movements.
Using Fair Value:
- The Fair Value Zone provides a balanced price level where the market is likely to return. Use this as a reference point for setting realistic entry and exit targets.
Strategic Planning:
- Combine Discount and Premium Zones with the Fair Value Zone to create a strategic trading plan.
- Monitor the zones for price reactions and adjust your trading strategy accordingly.
Best Practices
Historical Analysis:
- Regularly review historical price actions within the marked zones to understand market behavior.
Customization:
- Adjust the settings to suit your trading style and market conditions. Experiment with different zone lengths and line widths for optimal clarity.
Risk Management:
- Always use stop-loss orders in conjunction with the identified zones to manage risk effectively.
By integrating the Fundur Easy Zones indicator into your trading strategy, you can enhance your market analysis, make more informed decisions, and ultimately improve your trading performance.
We are Patient. We are Profitable.
Disclaimer
The information and publications are not meant to be, and do not constitute, financial, investment, trading, or other types of advice or recommendations supplied or endorsed by TradingView. Read more in the Terms of Use.