PROTECTED SOURCE SCRIPT
Close-to-Close % Change Distribution
Updated
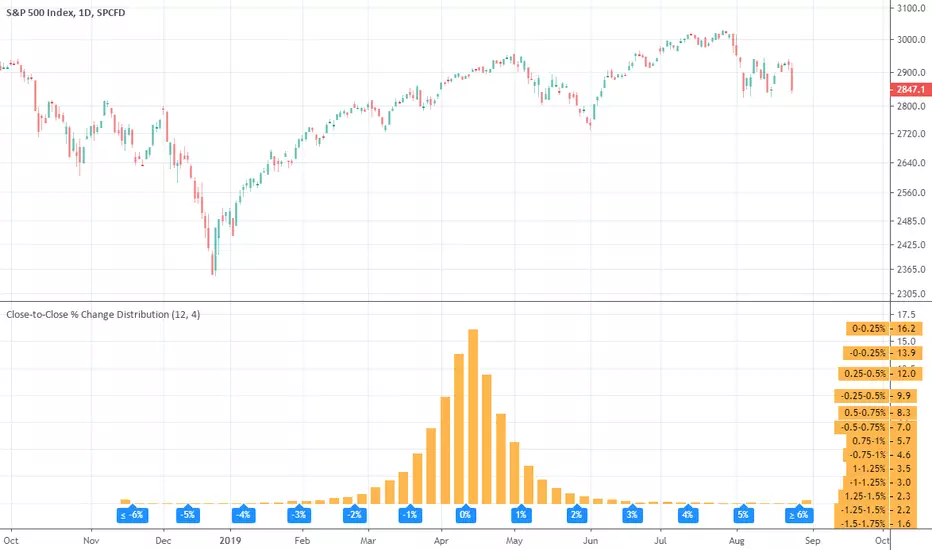
This is a graphical representation of things you see everyday in your watchlists - % Changes. This tool uses the entire history of an instrument. Different instruments have different distributions.
Oil

Gold

Bitcoin

Oil
Gold
Bitcoin
Release Notes
- Fixed -0.25% - 0% range
Freelance -> Telegram: @alex_everget
A list of FREE indicators:
bit.ly/2S7EPuN
A list of PAID indicators:
bit.ly/33MA81f
Earn $15:
tradingview.com/pricing/?share_your_love=everget
A list of FREE indicators:
bit.ly/2S7EPuN
A list of PAID indicators:
bit.ly/33MA81f
Earn $15:
tradingview.com/pricing/?share_your_love=everget
Disclaimer
The information and publications are not meant to be, and do not constitute, financial, investment, trading, or other types of advice or recommendations supplied or endorsed by TradingView. Read more in the Terms of Use.