OPEN-SOURCE SCRIPT
Magic levels
Updated

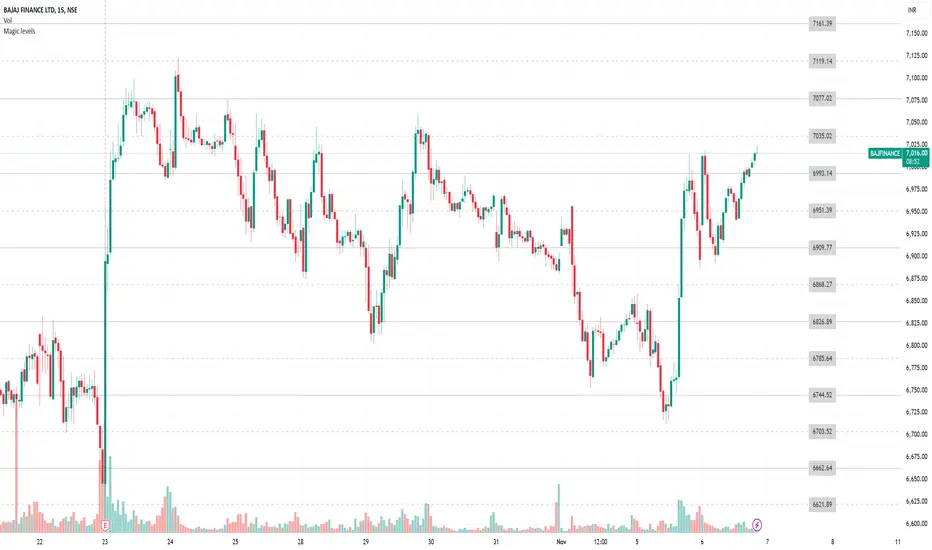
It is by far the simplest on chart presentation of Gann square of 9. It calculates the levels based on previous day closing. These levels usually acts as support and resistance.
Release Notes
This is by far the first on-chart representation of gann square of 9 levels based on previous day closing price. These levels can act as support and resistance.UPDATE (Nov 06, 2024): Added label over lines for ease of use. Thanks Umesh for this suggestion
Open-source script
In true TradingView spirit, the author of this script has published it open-source, so traders can understand and verify it. Cheers to the author! You may use it for free, but reuse of this code in publication is governed by House rules. You can favorite it to use it on a chart.
Disclaimer
The information and publications are not meant to be, and do not constitute, financial, investment, trading, or other types of advice or recommendations supplied or endorsed by TradingView. Read more in the Terms of Use.