OPEN-SOURCE SCRIPT
Trend & Momentum V2
Updated
Declutter your charts. Simple indicator combining trend and momentum using Moving Average (currently default to 9-day EMA) and RSI (default length of 8). A long signal is generated when the price closes above the moving average and the moving average color turns red to green which indicated that the momentum measured using RSI is greater than 50. A short signal is generated when the price closes below the moving average and the moving average color turns green to red indicating RSI is below 50. Confirmation is done if there is no reversal on the next candle. For best results use multiple timeframe charts to trade on the right side of trend and momentum.
Release Notes
Added the following1. Alerts for Long and Short Signals
2. Visual cues for Long and Short Signals
For folks who asked me how I use it. Once I get the signal I take a starter position at open of next session.
Release Notes
Added options for moving averages. SMA, EMA, RMA, WMARelease Notes
1. Improved long/short signal logic to accommodate for edge cases.2. Added a special mode for active traders who want to reduce price action noise which causes them anxiety and uncertainty. Price action in bars is given a bar color based on bias. Green for bullish bias, red for bearish bias, and white for neutral.
Release Notes
Faq: What time frame is best for this signal indicator?You can use any time interval you want eg. 1 minute, 1 hour, 1 day, 1 week, 1 month.
Note on lookback period settings.
The default configuration for the look-back period of 9 for trend and 5 for the momentum is an aggressive setting. You can try 20 for trend and 14 for momentum to reduce noise.
In this update:
Introducing Bull Vs Bear visual signals.
Introducing refactored alerts system.
The algorithm in the script is programmed to detect long or short bias during the time interval set in the alert.
1. Long signals are triggered when a long bias is detected and the price crosses above the previous session high.
1. Short signals are triggered when a short bias is detected in a bar and the price crosses below the previous bar low.
Release Notes
Title ChangeRelease Notes
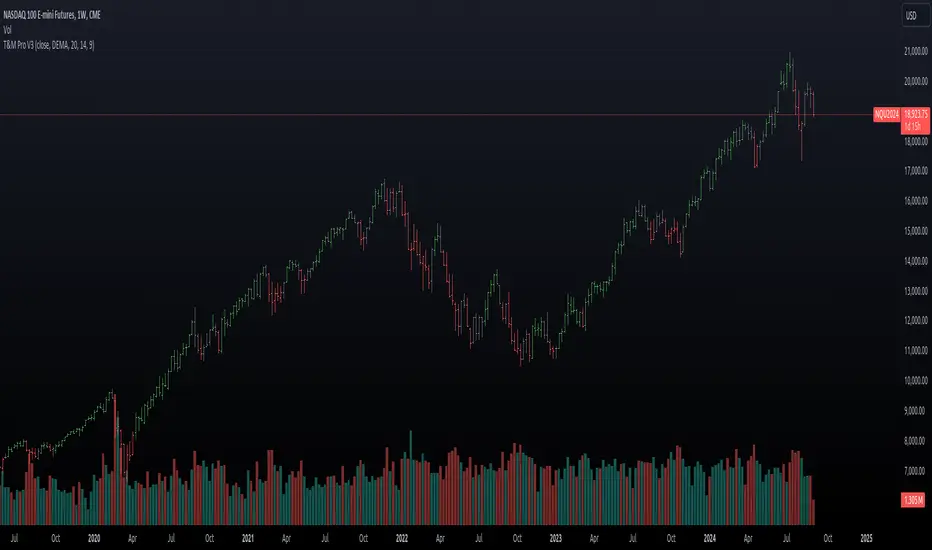
Trend & Momentum Pro V3 is a powerful indicator that combines trend analysis and momentum in one unified tool. This indicator utilizes a customizable Moving Average (MA) and the Relative Strength Index (RSI) to help traders identify potential buy and sell opportunities based on market conditions.Key Features:
Customizable Moving Average: Choose five types of MAs (DEMA, EMA, SMA, RMA, WMA) to suit your trading strategy. The length of the MA is also adjustable.
Momentum via RSI: The indicator calculates the RSI with an optional smoothing effect using an additional Simple Moving Average (SMA) of RSI values, providing refined momentum signals.
Dynamic Bias Detection: It identifies bullish and bearish market conditions based on both trend and momentum, giving clear long and short signals when the conditions align.
Signal Alerts: The indicator provides optional alerts for long (buy) and short (sell) trade signals, allowing you to stay ahead of market movements.
Color-Coded Candles: Candles are automatically colored based on market bias—green for bullish, red for bearish, and gray for neutral conditions—making trend recognition intuitive.
Customizable Display Options: You can choose to display or hide the Moving Average on the chart, and you can toggle the coloring of candles based on market bias on or off.
This indicator is ideal for traders looking to blend trend-following strategies with momentum analysis. It provides clear visual cues and alerts to improve decision-making in various market conditions.
Open-source script
In true TradingView spirit, the author of this script has published it open-source, so traders can understand and verify it. Cheers to the author! You may use it for free, but reuse of this code in publication is governed by House rules. You can favorite it to use it on a chart.
Disclaimer
The information and publications are not meant to be, and do not constitute, financial, investment, trading, or other types of advice or recommendations supplied or endorsed by TradingView. Read more in the Terms of Use.