OPEN-SOURCE SCRIPT
BTC NVM Ratio - Onchain Analysis
Updated

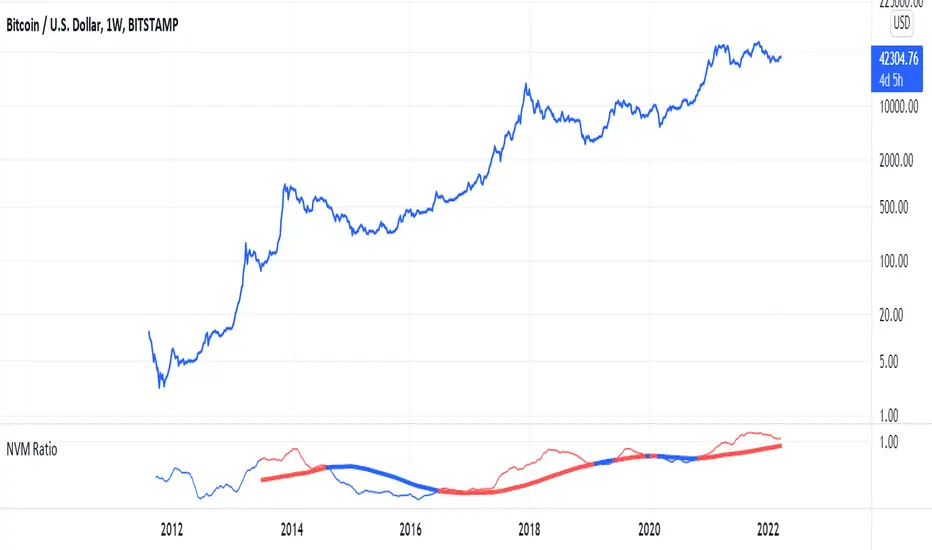
It is an onchain oscillator and is designed to operate at weekly timeframes and is only for Bitcoin.
Network Value to Metcalfe Ratio (NVM Ratio) is defined as the ratio of the log of market capitalization divided by the log of the square of daily active addresses in the specified window.
This oscillator evaluates bitcoin price according to the Metcalfe Ratio to shows whether the current value of Bitcoin is higher or lower than the real price
I made this comparison using a moving average of 100. The areas that are red in the weekly timeframe indicate that bitcoin is Overvalued. and The areas that are blue in the weekly timeframe indicate that bitcoin is undervalued.
Release Notes
fixed for weekly timeframeOpen-source script
In true TradingView spirit, the author of this script has published it open-source, so traders can understand and verify it. Cheers to the author! You may use it for free, but reuse of this code in publication is governed by House rules. You can favorite it to use it on a chart.
Disclaimer
The information and publications are not meant to be, and do not constitute, financial, investment, trading, or other types of advice or recommendations supplied or endorsed by TradingView. Read more in the Terms of Use.