OPEN-SOURCE SCRIPT
NAAIM Exposure Index

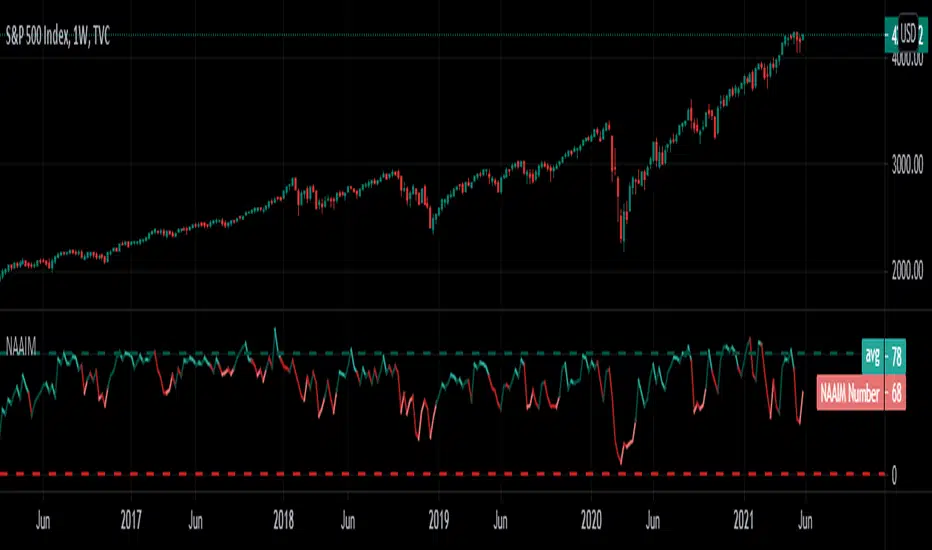
The NAAIM Exposure Index represents the average exposure to US Equity markets reported by members.
The line depicts a two-week moving average of the NAAIM managers’ responses.
It is important to recognize that the NAAIM Exposure Index is not predictive in nature and is of little value in attempting to determine what the stock market will do in the future. The primary goal of most active managers is to manage the risk/reward relationship of the stock market and to stay in tune with what the market is doing at any given time. As the name indicates, the NAAIM Exposure Index provides insight into the actual adjustments active risk managers have made to client accounts over the past two weeks.
Modifications
I have correlated the index line with its 21 MA , so below 21 MA determines weakness and breaking determine strenght in the sentiments.
How to use it rationally?
Try to find the "Divergence" .
Open-source script
In true TradingView spirit, the author of this script has published it open-source, so traders can understand and verify it. Cheers to the author! You may use it for free, but reuse of this code in publication is governed by House rules. You can favorite it to use it on a chart.
Disclaimer
The information and publications are not meant to be, and do not constitute, financial, investment, trading, or other types of advice or recommendations supplied or endorsed by TradingView. Read more in the Terms of Use.