PROTECTED SOURCE SCRIPT
MRP_DAILY_LEVEL
Intraday Indicator: #MRP_DAILY_LEVEL
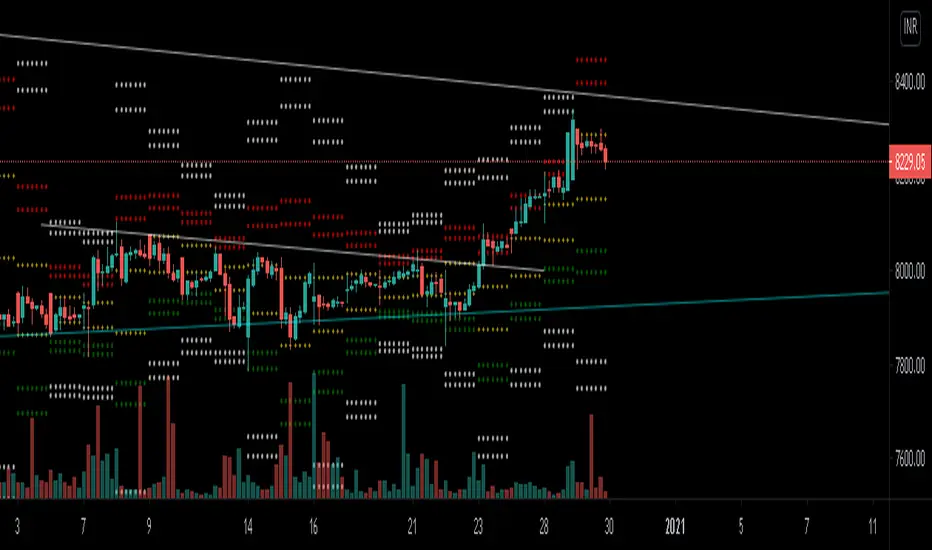
This indicator plots support and resistance levels based on fibonnaci levels.
1. Understanding The Levels:
Intermediate Zone is two brown coloured lines.
Resistance is two red coloured lines.
Support is two green coloured lines.
Buy target and Sell Target are white coloured lines on both sides.
-Price is strong when it is above the Intermediate Zone.
-Price is weak when it is below the Intermediate Zone.
-Price remains range bound when it stays inside the Intermediate Zone.
-Price is very strong when it's above Resistance Zone
-Price is very weak when it's below Support Zone
-Buy Target & Sell Target are the zones where you should take or trail your profit.
2.For Buying/Selling:
-Buy only when 15min close above Resistance Zone. SL below Resistance Zone.
-If 15min close is in huge range, you can buy/sell after pullback to Resistance/Support Zone.
-Also you can buy/sell if 15min close is above/below Buy/Sell target zone if you missed the rally.
-Sell only when the 15min close below Support Zone. SL above Support Zone.
Disclaimer
The information and publications are not meant to be, and do not constitute, financial, investment, trading, or other types of advice or recommendations supplied or endorsed by TradingView. Read more in the Terms of Use.